Asynchronous Network Management System (ANMS) User Guide
DOC-005443, Prepared by The Johns Hopkins Applied Physics Laboratory
This document is part of the Asynchronous Network Management System (ANMS).
Licensed under the Apache License, Version 2.0 (the "License"); you may not use this file except in compliance with the License. You may obtain a copy of the License at http://www.apache.org/licenses/LICENSE-2.0. Unless required by applicable law or agreed to in writing, software distributed under the License is distributed on an "AS IS" BASIS, WITHOUT WARRANTIES OR CONDITIONS OF ANY KIND, either express or implied. See the License for the specific language governing permissions and limitations under the License.
This work was performed for the Jet Propulsion Laboratory, California Institute of Technology, sponsored by the United States Government under the prime contract 80NM0018D0004 between the Caltech and NASA under subcontract 1658085.
- Initial, 30 August 2023Initial issue of document for ANMS v1.0.0
- A, 28 August 2024Updates for ANMS v1.1.0
- B, 31 July 2025Updates for ANMS v2.0
- 1.1. Top Ribbon Example
- 1.2. Reports per Minute Sample Display
- 1.3. Received Reports Sample Table
- 1.4. ARI Sample Table
- 1.5. Create a Custom Panel for Monitoring
- 1.6. Grafana Panel Creation Wizard
- 1.7. Sample Panel Data Selection from the amp-core Database
- 1.8. Search for Agents Known to the ANMS
- 1.9. Detailed Agent Information Provided by the ANMS
- 1.10. The Agent Sent Reports Dropdown Menu
- 1.11. Selecting a Report Sent by the Agent
- 1.12. Displaying a Report
- 1.13. Select an Operation and Parameter to Build a Control to Send to the Agent
- 1.14. Add an Agent to the ANMS
- 1.15. Manage an Agent
- 1.16. The Agent Management Menu
- 1.17. The Agent Management Preview ARI
- 1.18. The Agent Management Waiting Indicator
- 1.19. The Successful Managed Agent Toast
- 1.20. Select the Build Tab of the ANMS
- 1.21. ARI Text Input Toggle
- 1.22. ARI String Transcoder
- 1.23. Search Transcoded ARIs
- 1.24. Transcoded ARIs with String and CBOR Versions Shown
- 1.25. ARI Builder Toggle
- 1.26. ARI Search Bar
- 1.27. Search Available ARIs
- 1.28. ARI Parameter Input
- 1.29. Selecting an ARI Parameter
- 1.30. ARI Parameter Added to an AC
- 1.31. ARI Parameter Added to an AC concatenated in ARI text
- 1.32. ARI in "pending" State
- 1.33. Translated ARI with Input String and CBOR Output
- 1.34. Selecting the Status Tab with System Health Indicated as Good
- 1.35. ANMS Status
- 1.36. Selecting the ADMs Tab
- 1.37. Supported ADMs
- 1.38. Downloading ADM
- 1.39. Add an ADM by Uploading a JSON file
- 2.1. Toggle for Text-Edit Mode in Grafana
- 2.2. Sample Time-Based Rule Execution Visualization
- 2.3. Time-Based Rule Panel Displayed on Monitor Tab
- 2.4. Inspect ARI
- 2.5. Search for objects
- 2.6. Full execution set with inspect control
- 2.7. Generate Report ARI and CBOR Representations
- 2.8. Manage Agent ipn:2.6
- 2.9. Auto-filled CBOR in RAW Command Field
- 2.10. Auto-filled CBOR in RAW Command Field
- 2.11. Command Sent Successfully
Introduction
This User Guide provides an overview of the user interface (UI) and high-level workflows of the Asynchronous Network Management System (ANMS), which is part of the Advanced Multi Mission Operations System (AMMOS) suite of tools.
Identification
| Property | Value |
|---|---|
Configuration ID (CI) | 631.17 |
Element | Multi-Mission Control System (MMCS) |
Program Set | Asynchronous Network Management System (ANMS) |
Version | 3.0 |
Scope
This document describes the user interface and workflows of the ANMS. For technical details about the ANMS architecture, installation, upgrade, monitoring, and maintenance see the ANMS Product Guide.
Terminology
- Abbreviations
- Asynchronous Management Protocol (AMP)
The application protocol used to communicate between ANMS and its managed agents.
- Application Data Model (ADM)
The definition of a collection of objects in an AMP agent. Each agent can support any number of ADMs but only one version of each ADM.
- Operational Data Model (ODM)
The collection of objects defined by an Agent during its runtime which are not defined in an ADM.
- Asynchronous Resource Identifier (ARI)
A text identifier for any object in the ADM or ODM of an Agent. This is used to command an Agent and to identify reported data from an Agent.
- Roles and Subsystems
More details on these topics can be found in the ANMS Product Guide.
- User
The human accessing the ANMS via a web browser or a machine accessing via a "northbound" API.
- Administrator
A user having an account marked as a special role with extra access to the ANMS for monitoring and troubleshooting.
- Manager
A subsystem of the ANMS which sends commands to and receives reports from all defined Agents.
- Agent
A device being managed by the ANMS, but separate from the ANMS itself. All agents must be accessible via some network, but not necessarily an IP network.
- UI Terminology
- Link
A browseable item within a web page which accesses a specific item on the same page or a different page.
- Redirect
An automatic change in the current web page caused by some action on the current page.
- Select
A user input via a Web Browser to either click with a mouse or keyboard.
- Choose
Selecting an item from a drop-down list of available options.
References
| Title | Document Number |
|---|---|
DOC-001455 rev G | |
DOC-005444 rev A |
| Title | Reference |
|---|---|
Chapter 1. User Interface
The following section provides an overview of the ANMS User Interface, organized by the capabilities provided by each of the tabs - Monitor, Agents, Build, Status, ADMs - shown at left side pop-out menu of the ANMS display.
1.1. User Accounts and Login/Logout
The first thing that must happen before a user can access the ANMS is to log-in with an authorized user account. The Common Access Manager (CAM) controls authentication, authorization, and auditing (AAA) functions for the ANMS (and other AMMOS tools) so any account creation or maintenance must be done in either CAM or its Active Directory user database.
The leftmost side of the ribbon contains the ANMS name and version identifier. The rightmost side contains the profile info link, along with a "Logout" link.

Selecting the Logout link will immediately cause the login session to be ended and the browser will redirect back to the login page.
1.2. Monitoring
The Monitor tab uses Grafana to display data stored in the ANMS databases, which are populated with information collected from the Managers and Agents in the network.
There are four default displays that are populated at the top of the Monitor tab, in addition to the option to build custom graphs and visualizations of the information monitored by the ANMS.
Based on your network configuration and if you have previously authenticated to Grafana, the browser may present a login window (either a pop-up or a menu that drops from the top of the window, based on your browser). This is the Nginx server proxying authentication to Grafana. This ensures that the Grafana panels do not render to anonymous users.
1.2.1. Default Panels
1.2.1.1. Reports per Minute
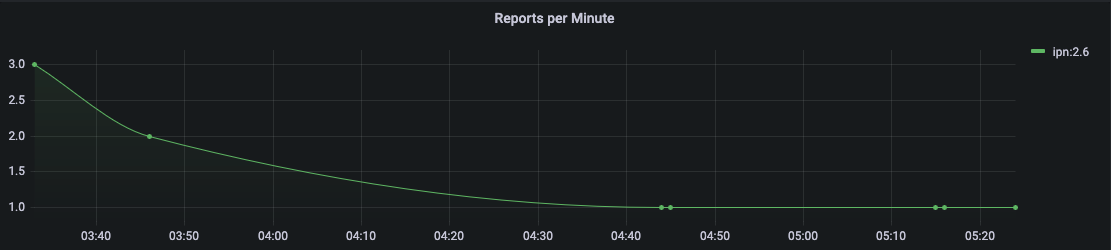
The Reports per Minute visualization in the top of the Monitor tab displays the rate of reports generated by Agents and stored in the database by the Manager.
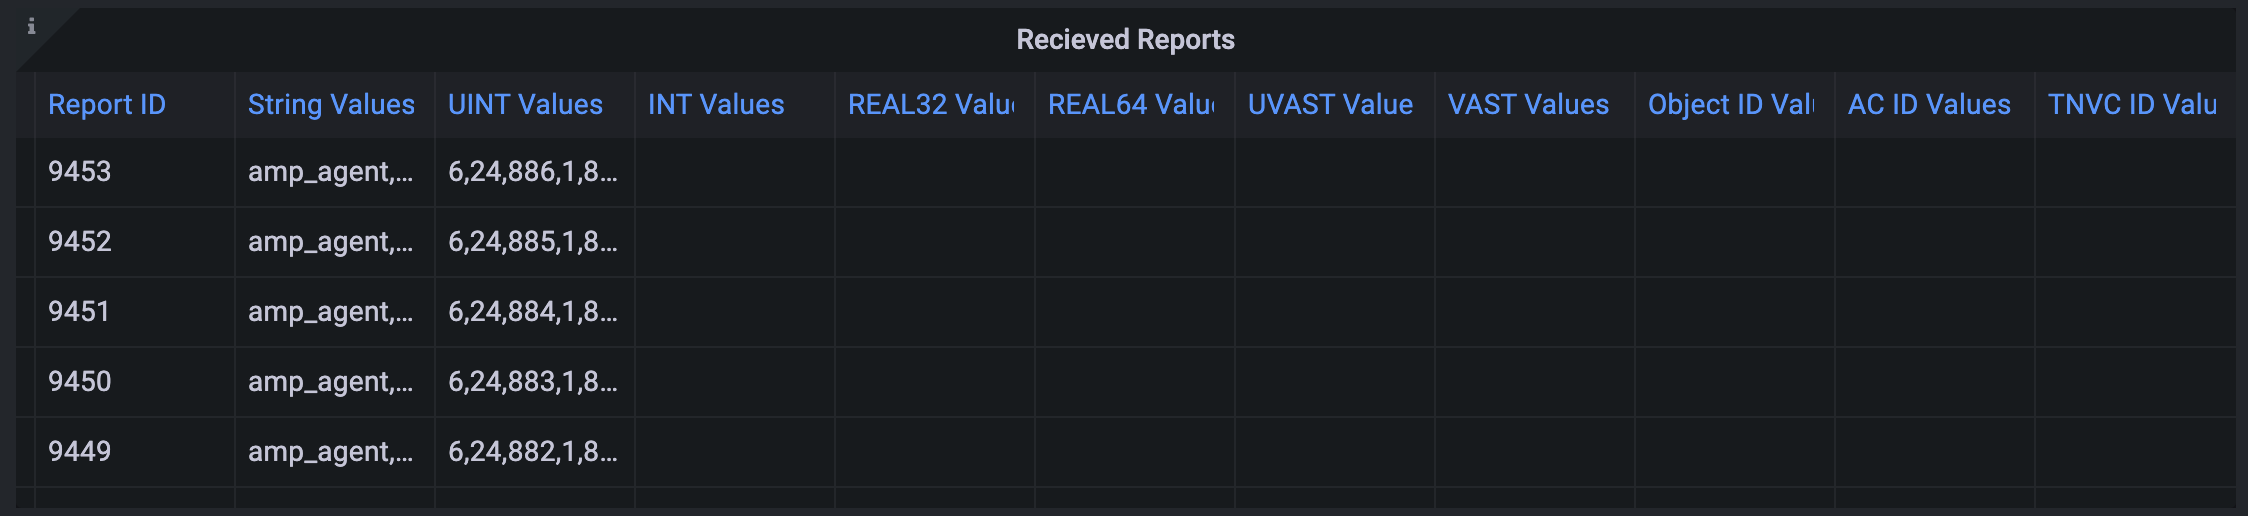
1.2.1.2. Received Reports
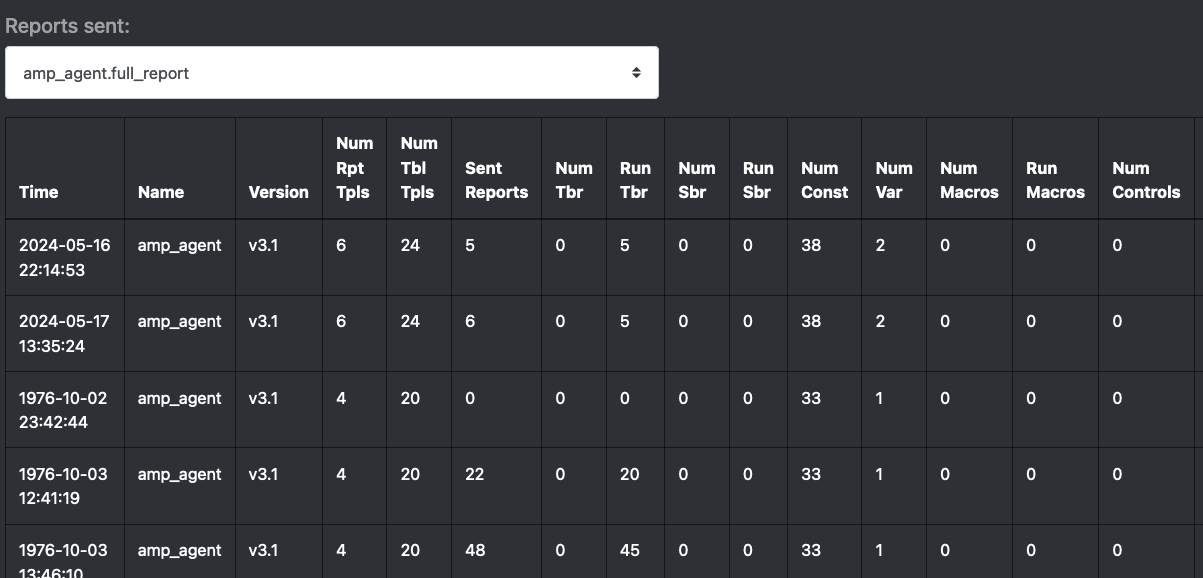
The first table on the Monitor tab displays information from all reports the Manager has received and stored. The values in this table are organized by type; the report template needs to be used to decode the report entry values.
The report entries are populated with: * Time the report was received * ID of the Agent that generated the report * Correlator Nonce of the execution set that trigger the report generation * Values included in the received report in string format * Values included in the received report in binary format
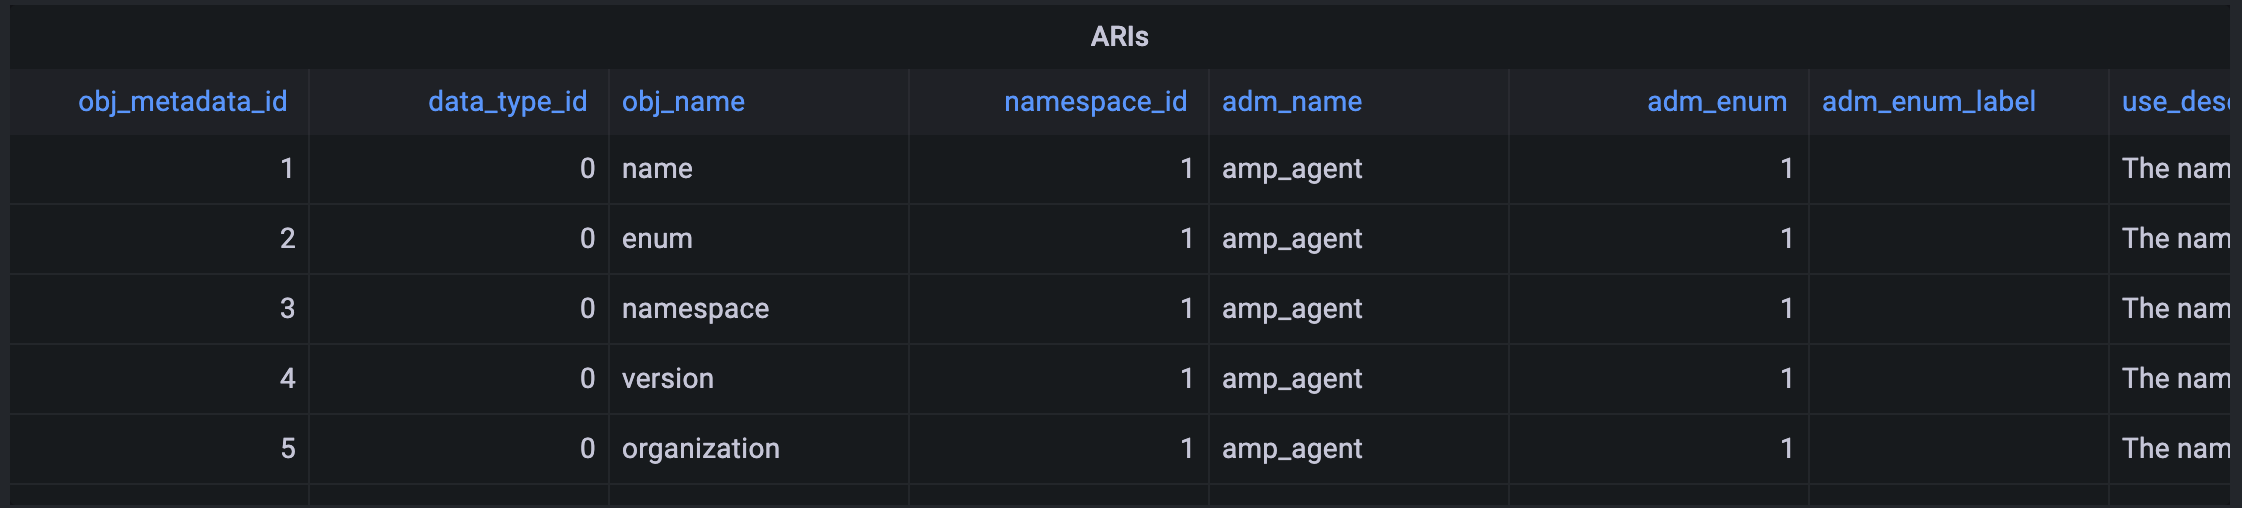
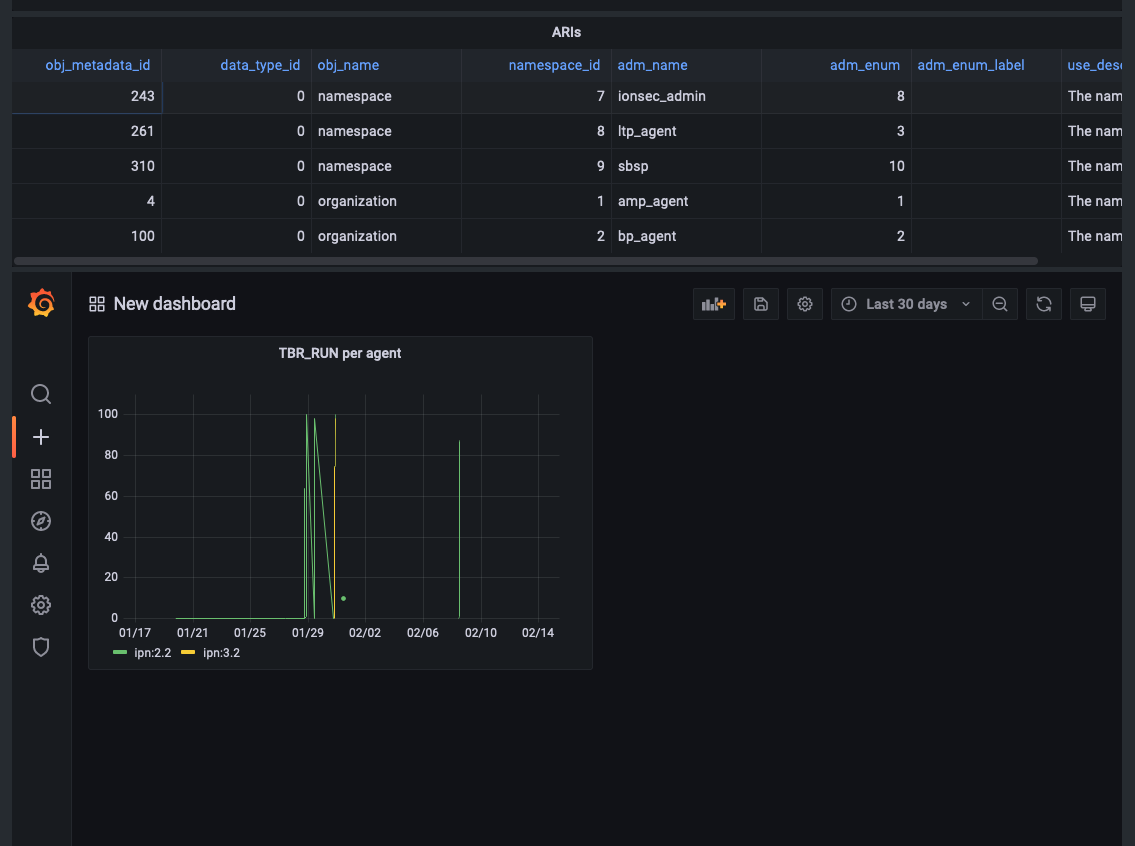
1.2.1.3. ARIs
The second table on the Monitor tab displays all of the ARIs stored in the database. These resource identifiers are useful in showing the messages that can be built and sent to an Agent.
The ARI table entries include: * The object metadata ID * Data type ID * Name of object * Data model ID * Object enumeration * Status * reference * Description of the ARI * Data model name * Enumeration of the data model * Namespace typ of the data model * Description of the data data model
1.2.2. Creating Custom Panels
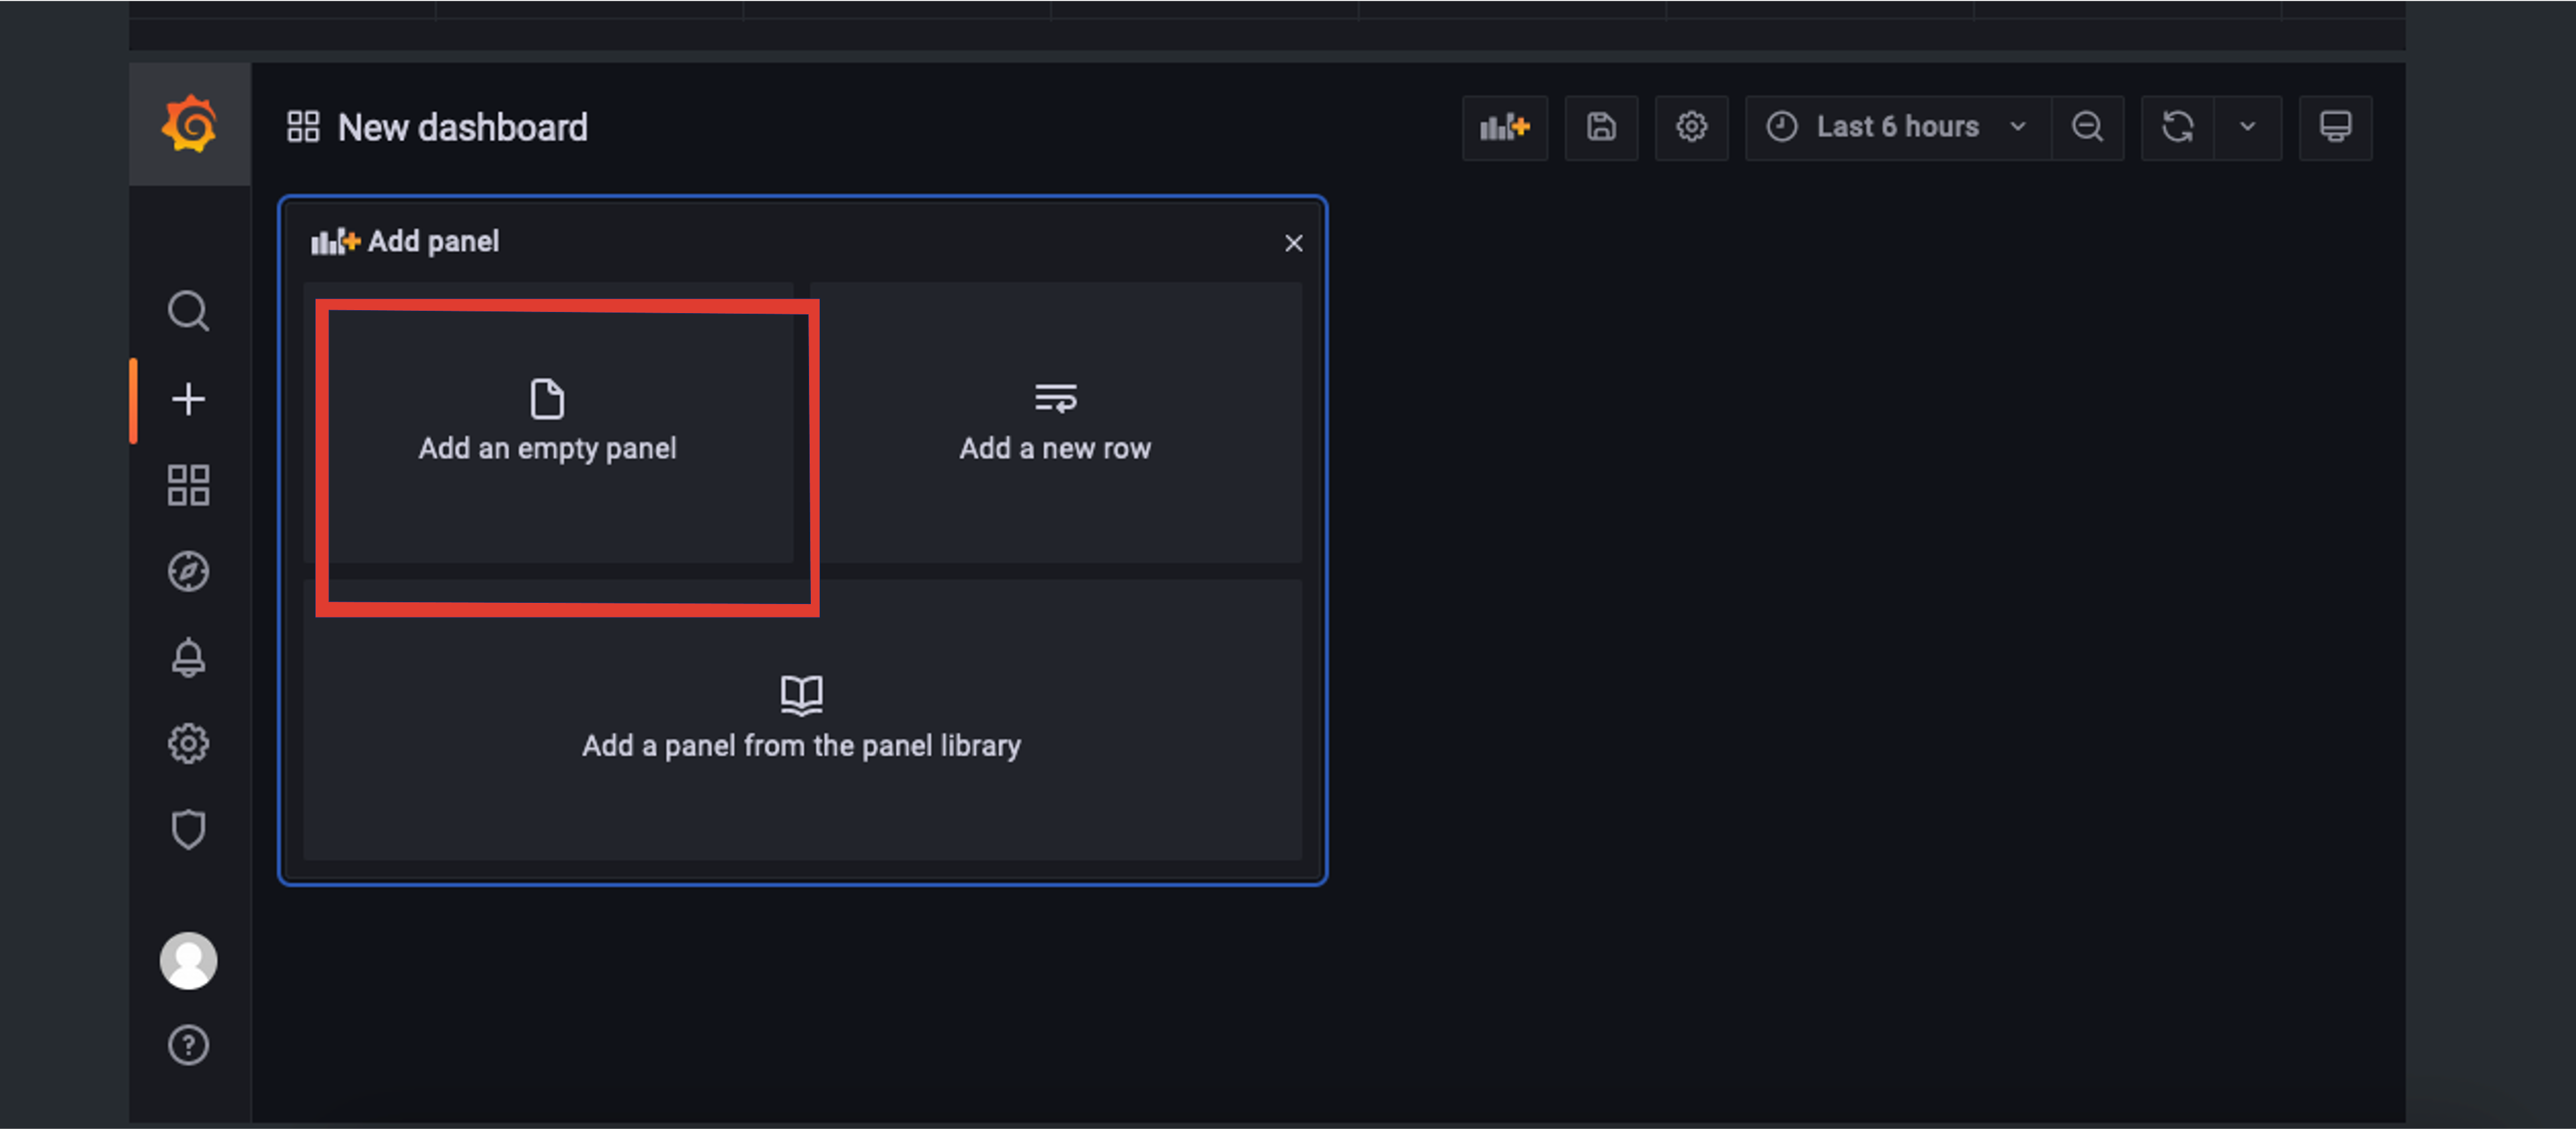
The Grafana display at the bottom of the Monitor tab allows a user to create custom panels - graphs, charts, alerts, etc. - to visualize information gathered by the ANMS that is stored in the database.
Navigate to the Monitor tab, and select New Panel under the Grafana section.
A new page is then displayed; this is the Grafana’s panel creation wizard.
There are three sections in the panel creator, which can be resized for easy viewing and editing.
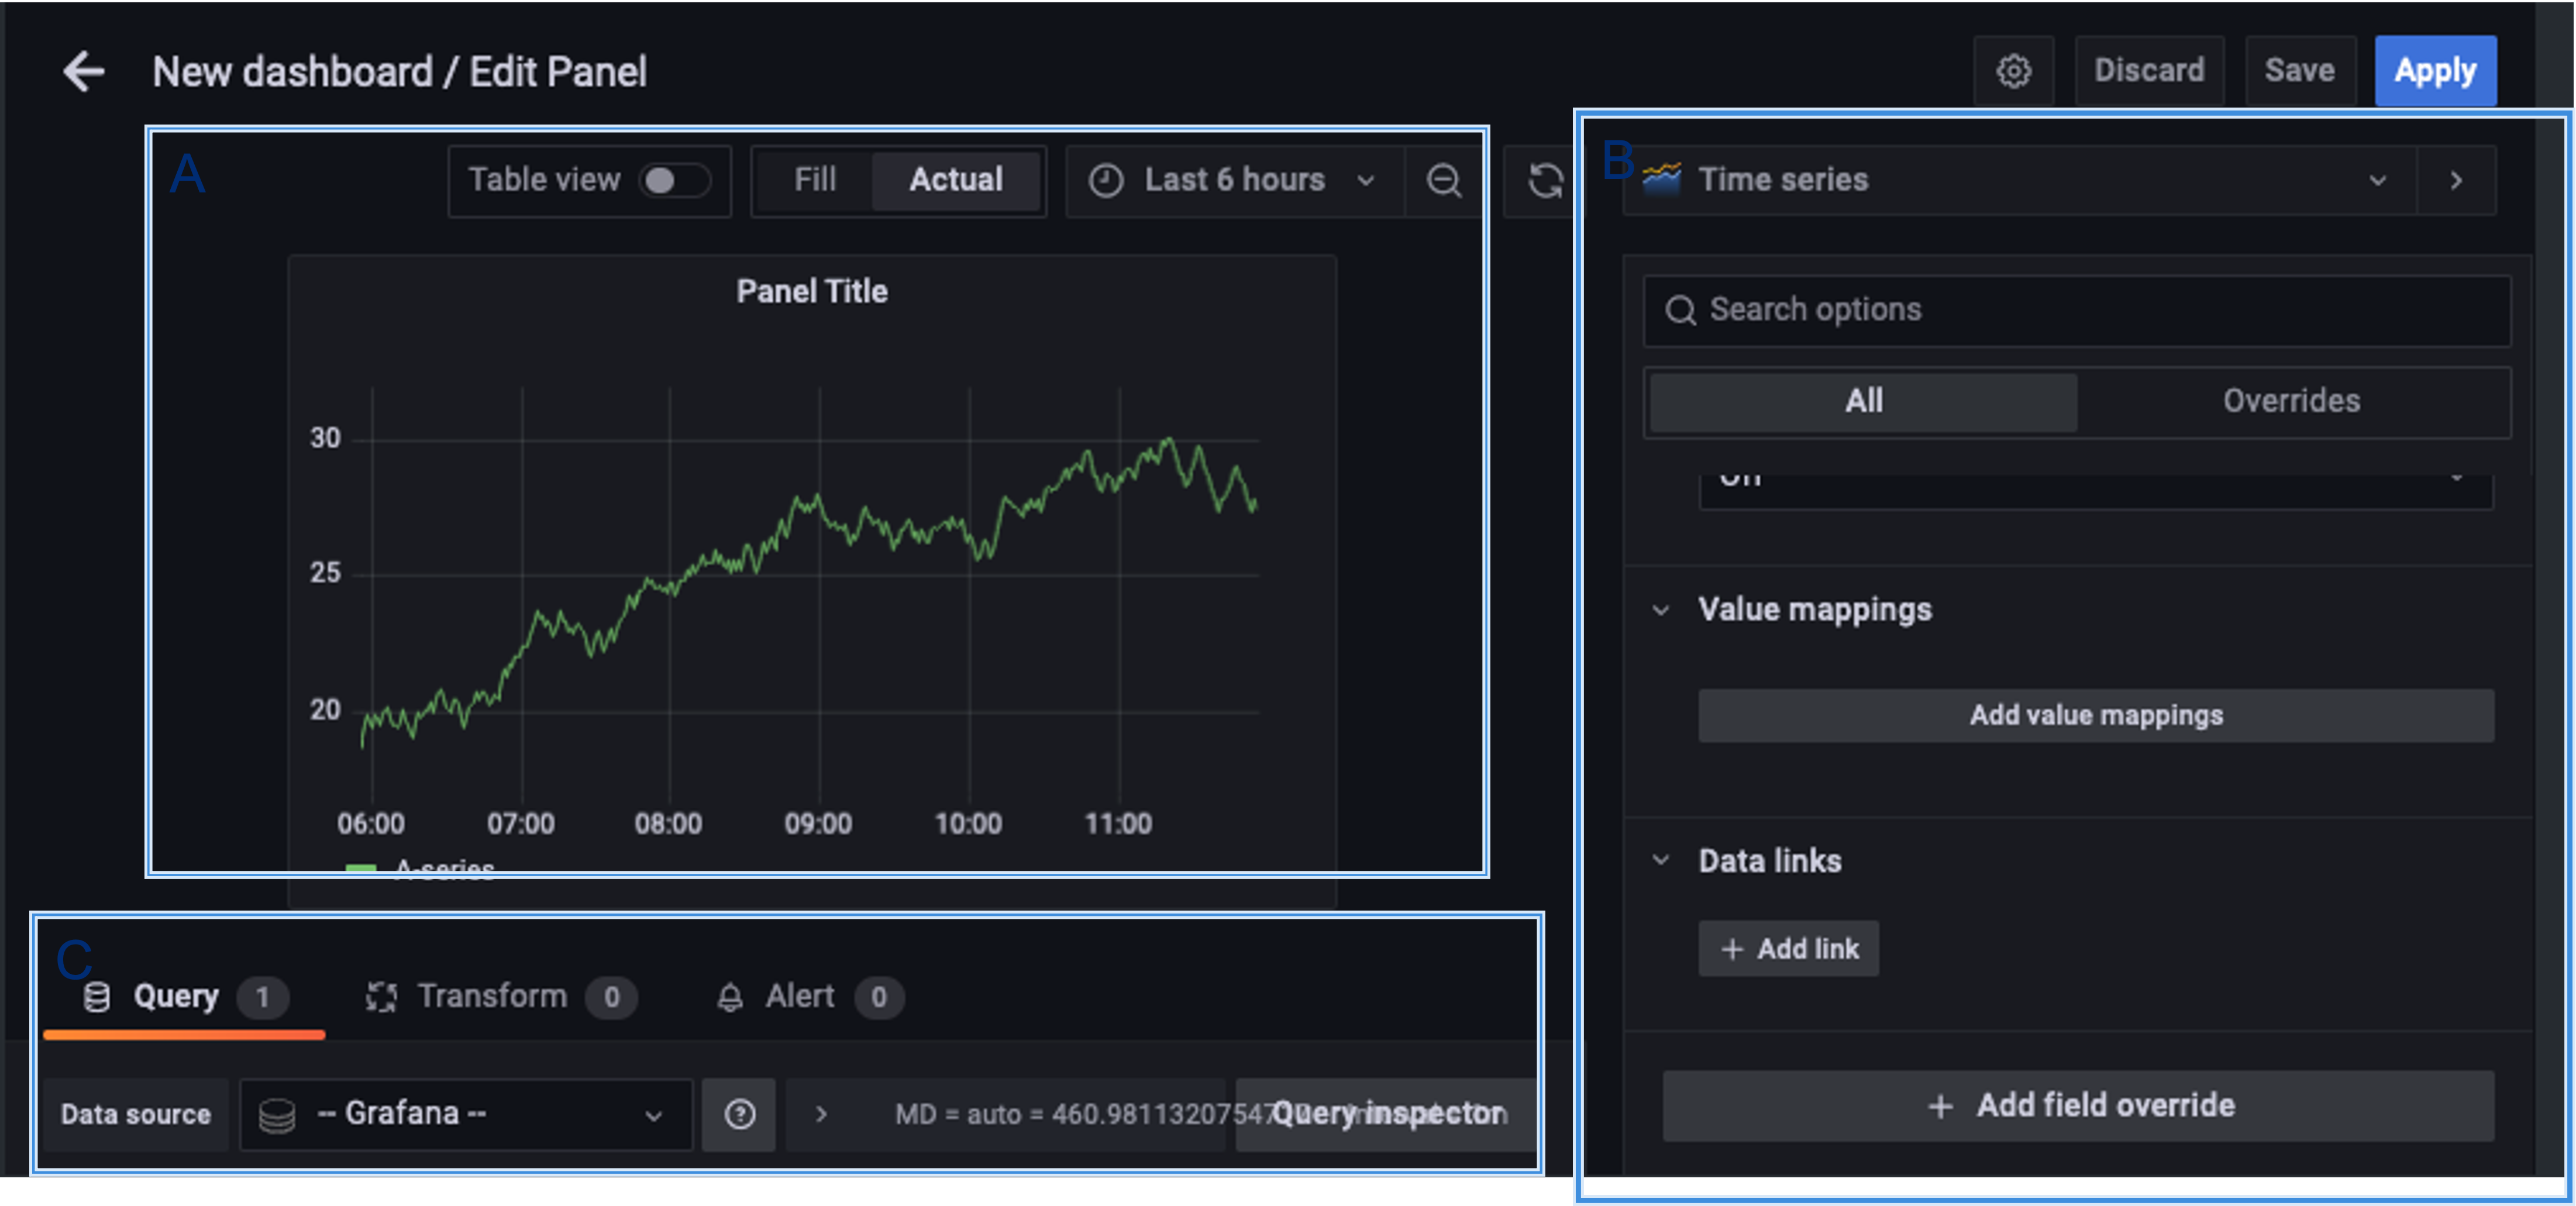
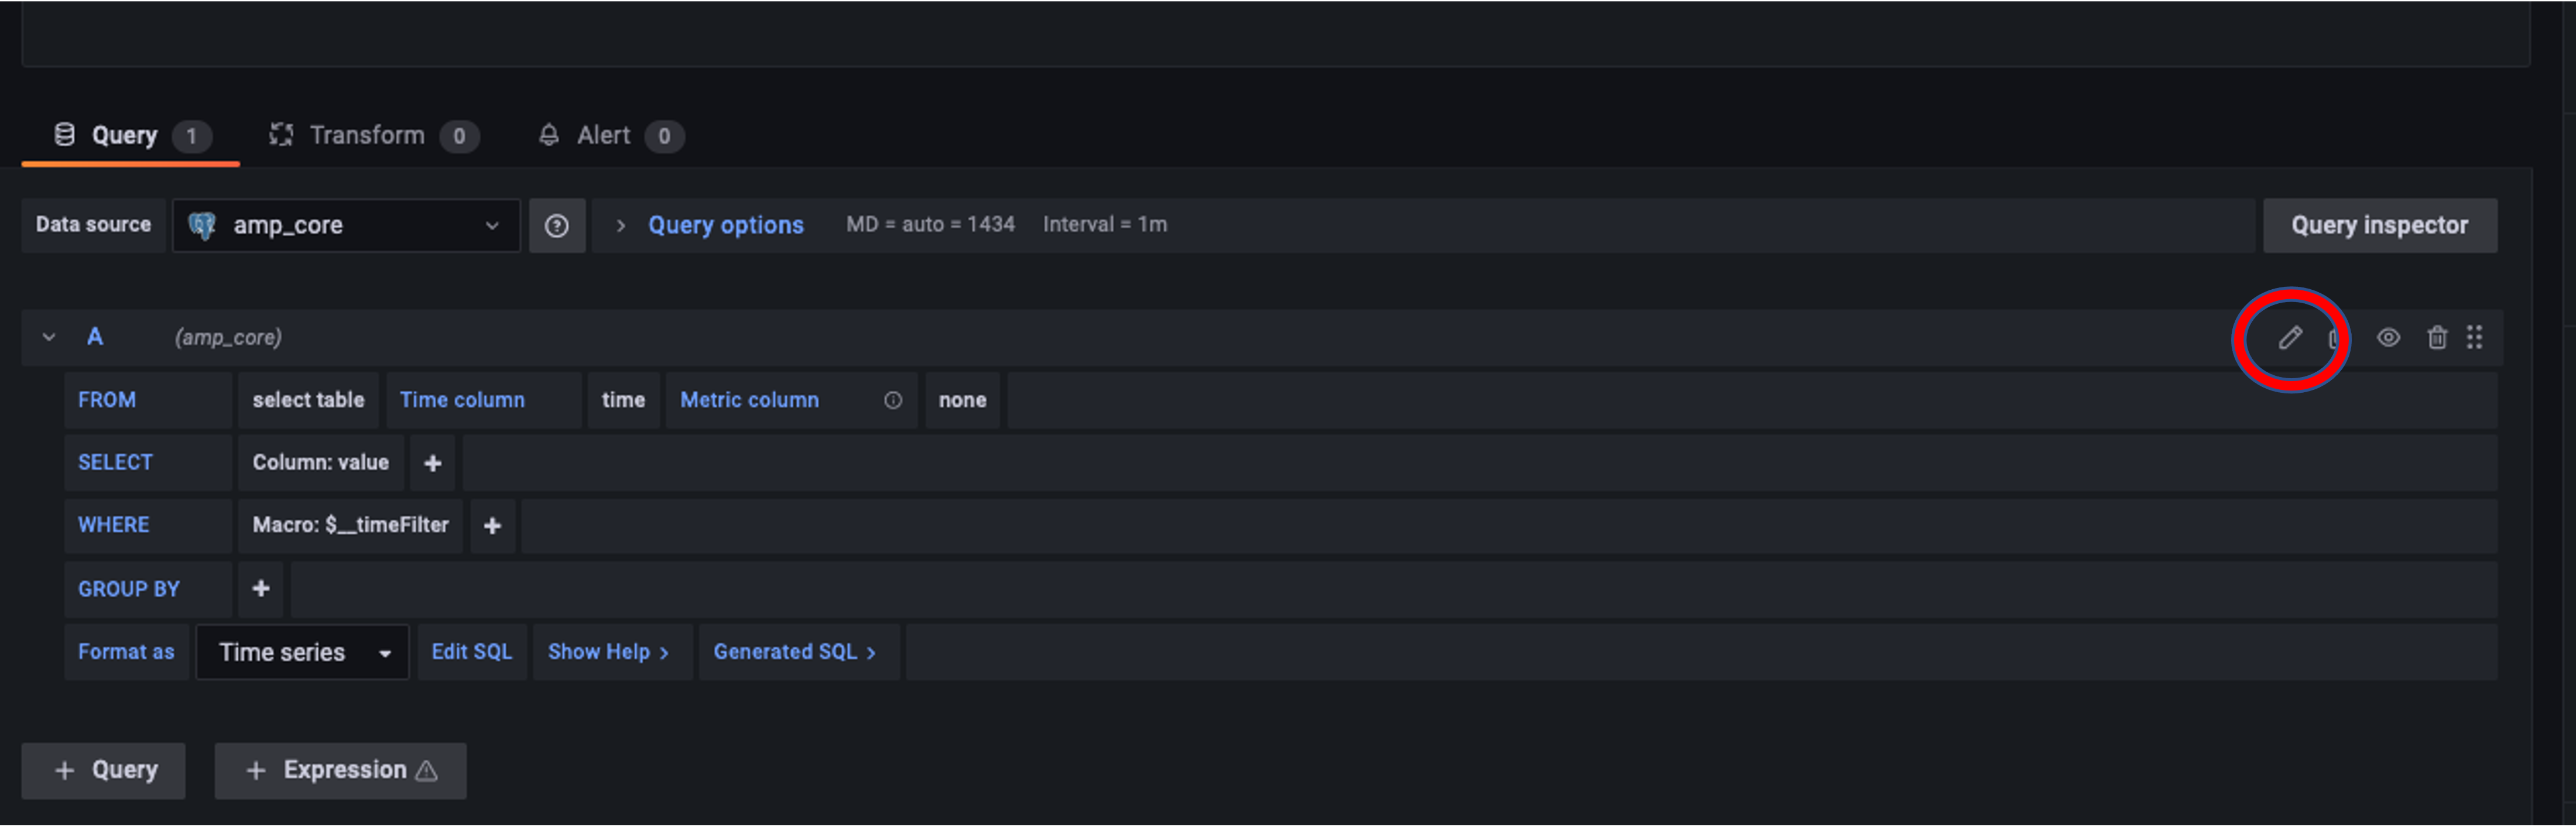
Section A, as depicted in Figure 1.6, “Grafana Panel Creation Wizard” in the upper left box, displays a preview of what the panel you are creating will look like or will show an error screen if it can not be generated.
Section B, in the bottom left of Figure 1.6, “Grafana Panel Creation Wizard”, is where you select the data you would like to display in your custom panel. It is best to resize this section to easily set up the data you would like to view.
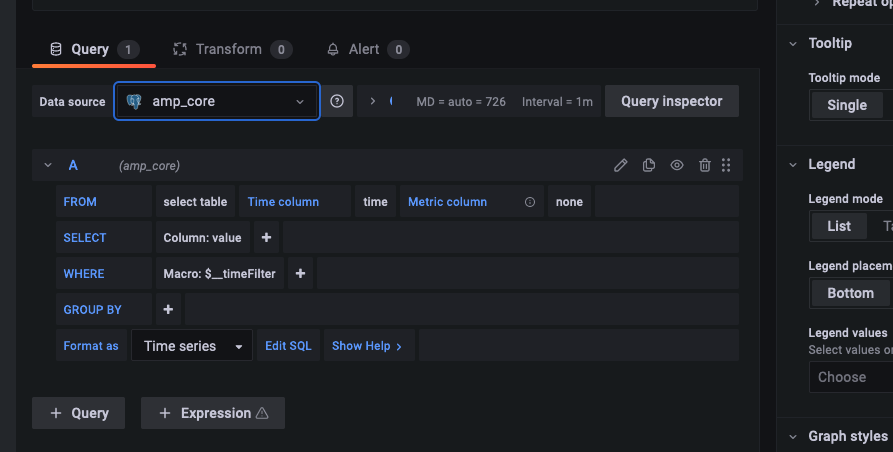
Under data source, you can select which database to use. amp_core is a PostgreSQL database for ANMS that contains health and status for the
ANMS system and stores the information generated and used by the AMP network manager. The amp-core database is selected in the sample query
provided in Figure 1.7, “Sample Panel Data Selection from the amp-core Database”.
Section C, on the right side of Figure 1.6, “Grafana Panel Creation Wizard”, provides the settings for the panel. You can edit the title of the graph, the type of graph, and other attributes.
To build out a Grafana panel, select the amp_core database to display data from the manager. Then, choose the table or view from the database
that you wish to display.
Not every table has a timestamp entry, so you might need to change the type of graph you are attempting to use if data is not displaying as expected. You can change the type of graph you would like to use in Section C.
Next, select the columns you would like to use. The Generate SQL option may be useful to you if you are familiar with SQL.
Once the data for the panel is selected, you can preview the graph in Section A.
The Query Inspector button will display the results of the SQL query and is useful for debugging if the panel is not displaying correctly.
Additional information on the use of Grafana to build panels can be found in the detailed documentation available online [grafana-docs], including a tutorial on building a [grafana-dashboard] and instructions on how to customize [grafana-panels].
1.3. Agents
The Agents tab can be used to search for Agents known to the ANMS, get additional information on these Agents, and add new Agents to the system.
The search bar at the top of the page allows a user to search the Agents known to the ANMS by:
ID String (Example: ipn:1.1)
Time Agent was First Registered (Example: 2023-02-16T19:44:20.805658)
Time Agent was Last Registered (Example: 2023-03-20T17:13:41.284906)
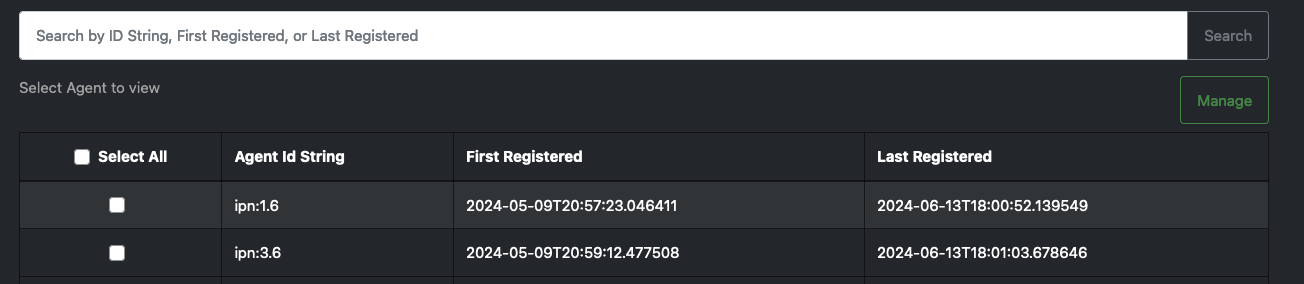
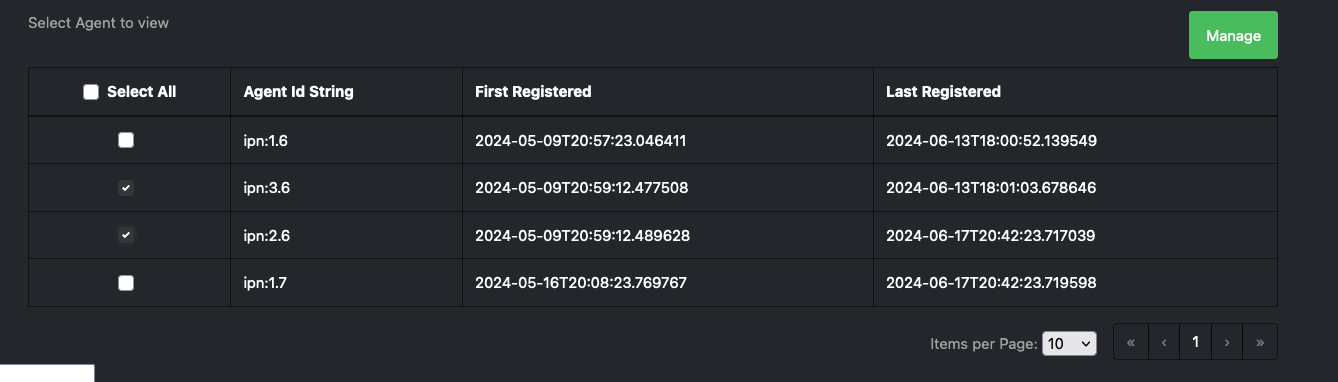
The table in the middle of the Agents page displays the Agents registered with the ANMS, giving the Agent ID String and the times that agent was first and last registered.
For additional information on a specific Agent, click a row in the table. The Agent details are displayed, including:
Registered Agent ID
Agent ID String
Time Agent was First Registered
Time Agent was Last Registered
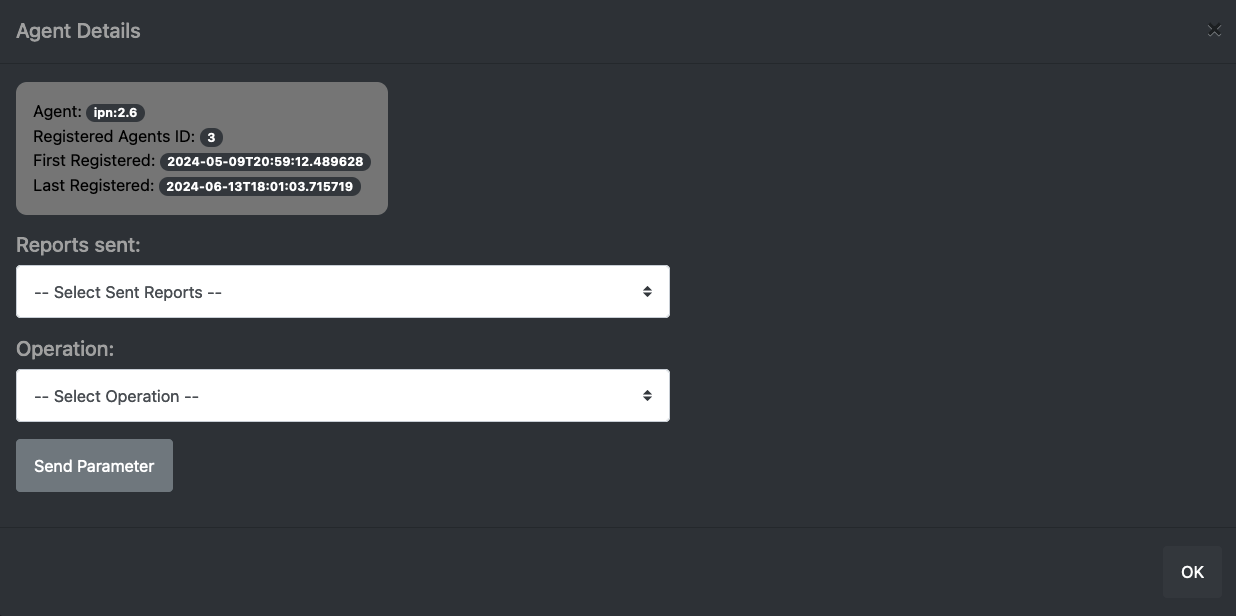
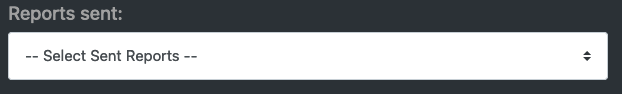
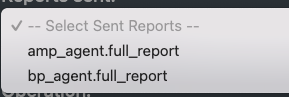
The first dropdown, labeled "Select Sent Reports" provides a list of reports that an Agent has sent.
Select a report from the list for additional data.
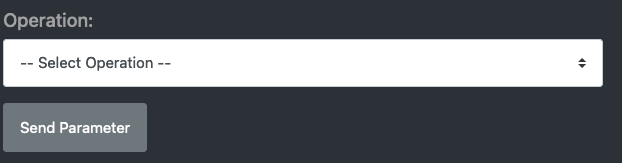
The second dropdown menu allows the user to build a command to send to the currently selected Agent.
The Select Operation dropdown can be used to select the operation for the command, and the text box to the right accepts any parameters,
as a comma separated list, necessary for that command.
Click the Send Parameter button to send the control to the agent.
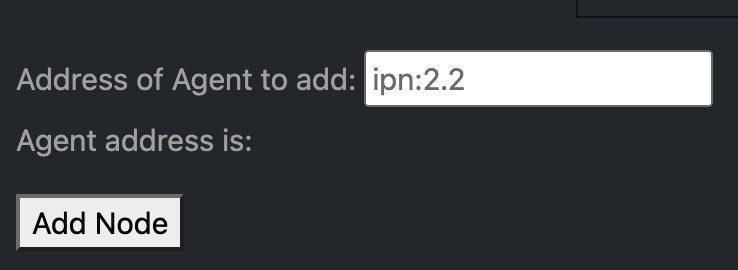
Adding an Agent to the ANMS can be done from the Agents page as well. Enter the Address of the Agent to add to the ANMS, and select the Add Node button.
To manage an Agent(s), select the agent(s) to be managed from the agent table, then select the manage button in the upper right part of the table.
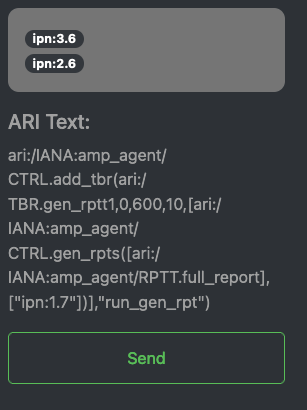
From this Agent management menu, the user can: 1. Generate a new ARI to send to the agent(s) 1. Send a pre-built string ARI to the agent(s)

The manage tab uses the same system as the build tab to generate ARIs. See Build on how to generate new ARIs. A user will be able to preview the generated ARI before sending it to the agent(s). A status indicator will be displayed as the ARI is being translated

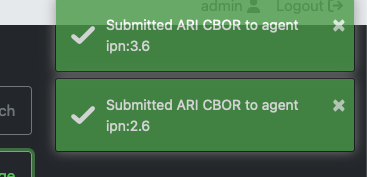
After the ARI is translated and successfully sent to the manager to be forwarded to the agent(s), a status toast will be displayed.
1.4. Build

The Build tab is for used for generating ARIs, translating string ARIs to CBOR, and sending those ARIs to the ANMS database and/or Agent(s). All ARIs in the ANMS database can be used to generate new string ARIs using the ARI Builder that can be translated using the ARI String Input option. To switch between building ARIs via dropdown menus, defining ARIs with plaintext, and translating ARIs from hex (CBOR), use the toggle at the center of the screen beneath "ARI Builder".
When first navigating to this tab, the ANMS compiles all known ARIs, including their parameter information, from the database.
1.4.1. ARI String Input
In the Text Input mode, the ANMS transcodes string ARIs to CBOR, which can then be sent to Agents. To perform this translation, toggle the switch at the top of the screen to select the ARI Text Input option.

In the top input box, enter a string ARI (Ex: "ari://ietf/dtnma-agent/EDD/num-msg-rx") and select the SUBMIT button to transcode the given ARI. The CBOR generated by the ANMS will be populated in the table below the input options on the page, as shown in Figure 1.24, “Transcoded ARIs with String and CBOR Versions Shown”.

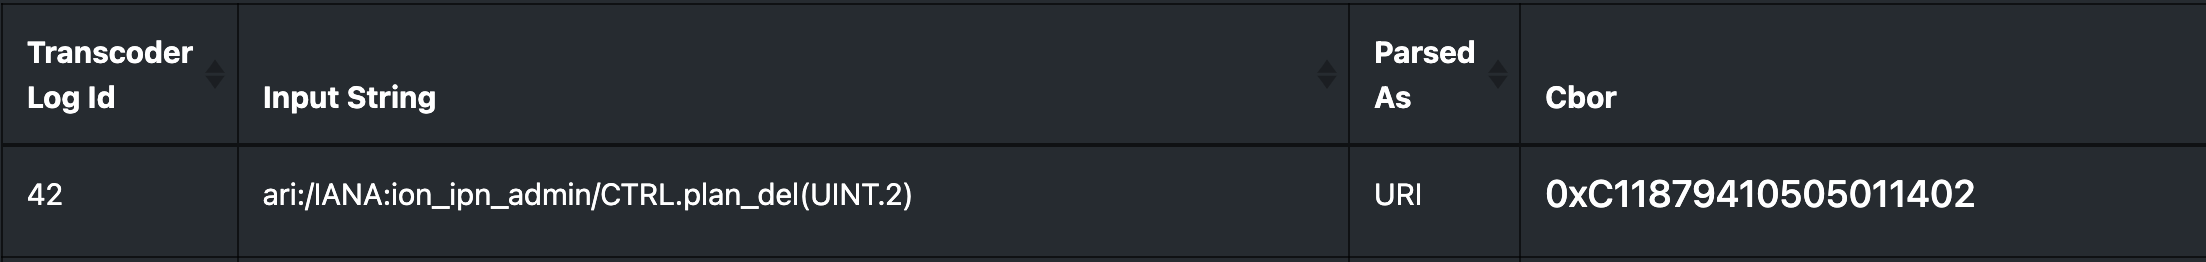
To search the ARIs that have been transcoded by the ANMS, enter one of the following: 1. Transcoder Log ID 2. String ARI (URI) 3. CBOR
Next to the search button is the refresh button that can be used to refresh the entries in transcoder log id table. Entries are updated when new entries are submitted or when switching between pages.
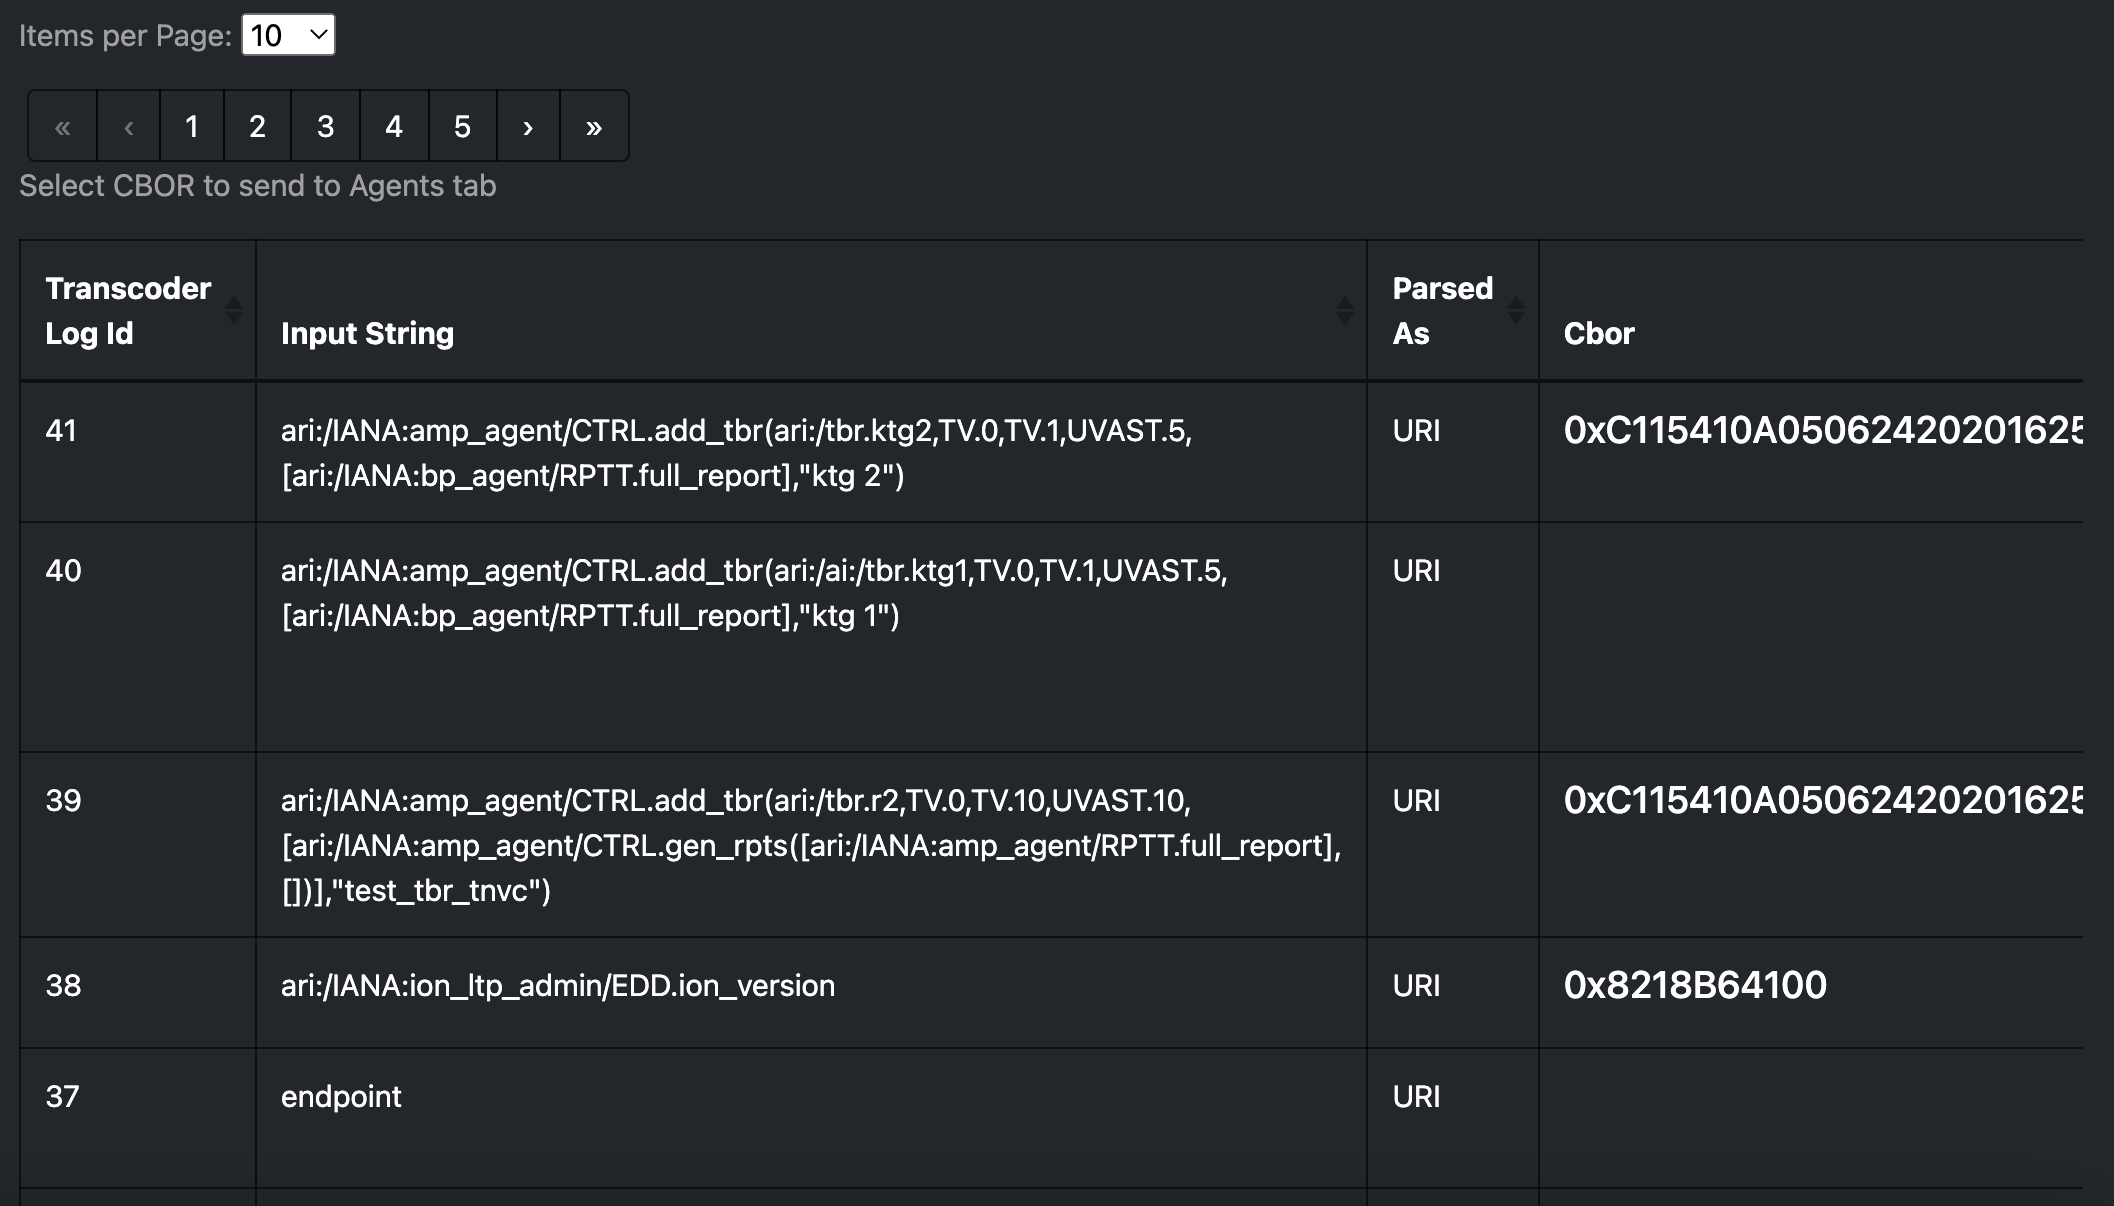
The transcoded ARIs are presented in the table at the bottom of the Build tab. The table provides the Transcoder Log ID, String form of the ARI, a description of what the provided string was parsed as (currently, all string input is parsed as a URI), the CBOR translation for the ARI, the URI, and details on transcoding errors if an issue with the input was detected.
1.4.2. ARI Builder

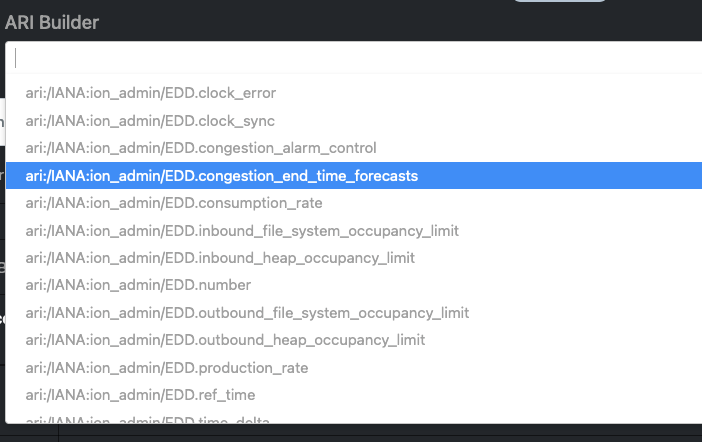
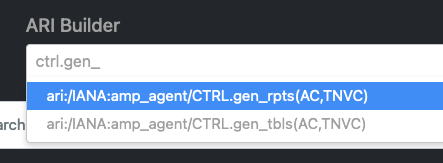
The ANMS allows a user to build ARIs from existing ADMs. To begin building an ARI, type in the search bar as shown in Figure 1.26, “ARI Search Bar” to filter available ARIs by type, ADM, or name. Also there is a checkbox to toggle if the ARI will be apart of an execution set. When selected a new correlator_nonce field will appear where a user can populate with a unique nonce that is used to track report sets generated by the execution set.

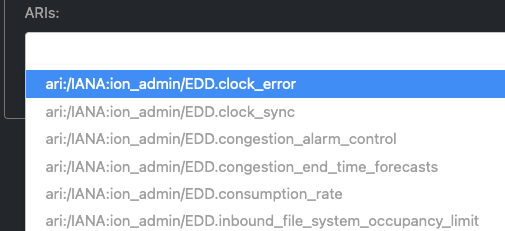
The user may also choose an ARI from the drop down list, as shown in Figure 1.27, “Search Available ARIs”.
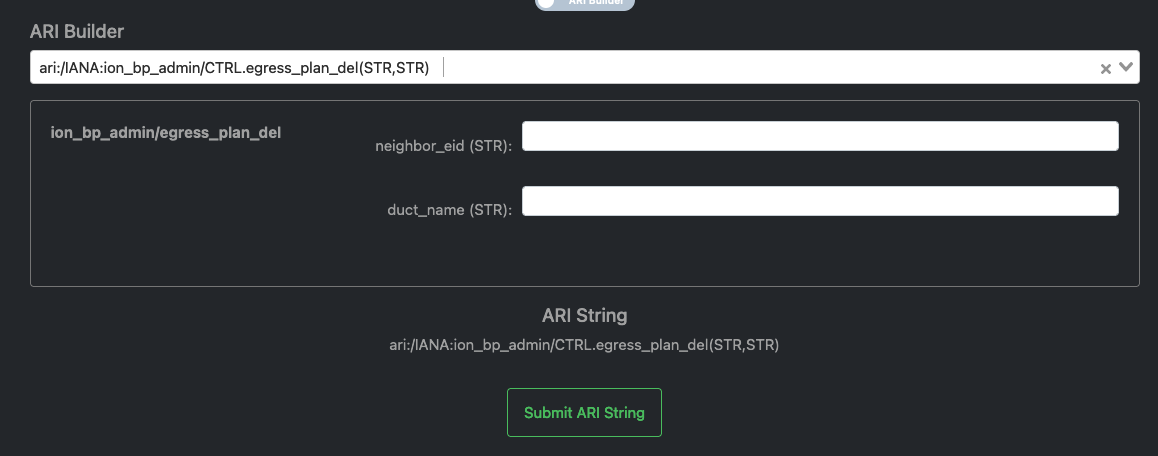
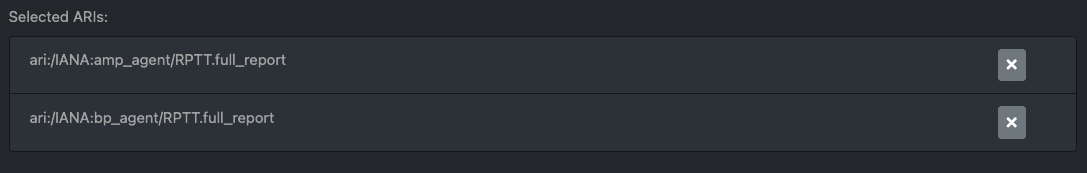
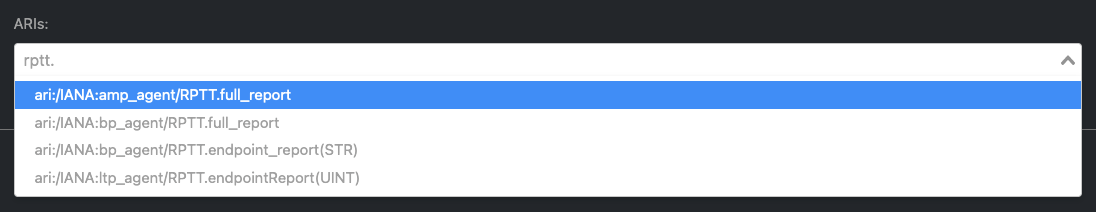
If the chosen ARI has parameters, input boxes will be provided for each required field. The parameters will be displayed as a comma separated list after the name of the ARI. ARIs with complex parameters include additional guidance for populating these required fields. For instance, an ARI Collection (AC) builder is provided for ARIs requiring an AC parameter, as shown in Figure 1.28, “ARI Parameter Input”. The left side of the screen allows a user to search for the ARI they want to add to the AC and the right-hand side of the screen displays the selected ARI(s).
ARI parameters can be searched and selected from a dropdown menu, similar to the search to initiate the ARI build process.
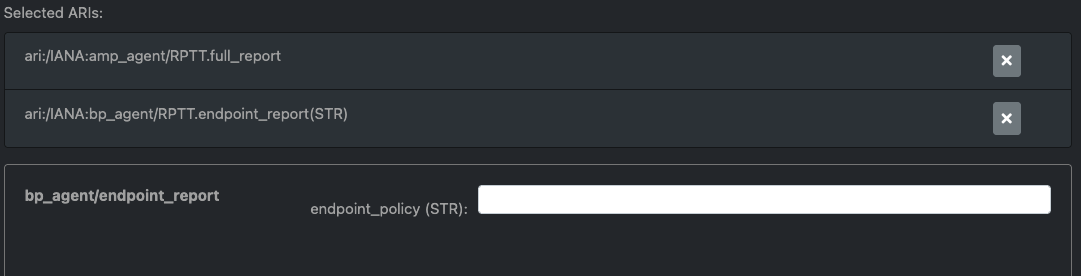
When an ARI is selected from the search box on the left, it is populated in the box below, Selected ARIs. The finale ARI is updated automatically as new ARIs are added or removed from the AC.
For parameters that also require parameters, the system will generate additional input fields.
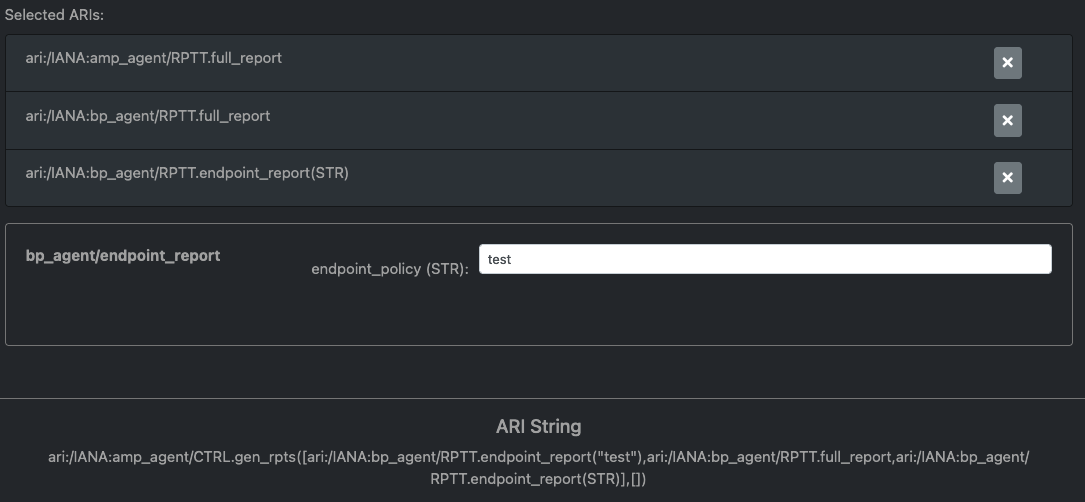
After all ARI parameters have been filled in, the system will generate the new string URI that is shown beneath the parameter fields. This string URI is sent via anms-core to the transcoder to be translated. The final result of the translation is displayed in the table at the bottom of the page, as depicted in Figure 1.33, “Translated ARI with Input String and CBOR Output”.
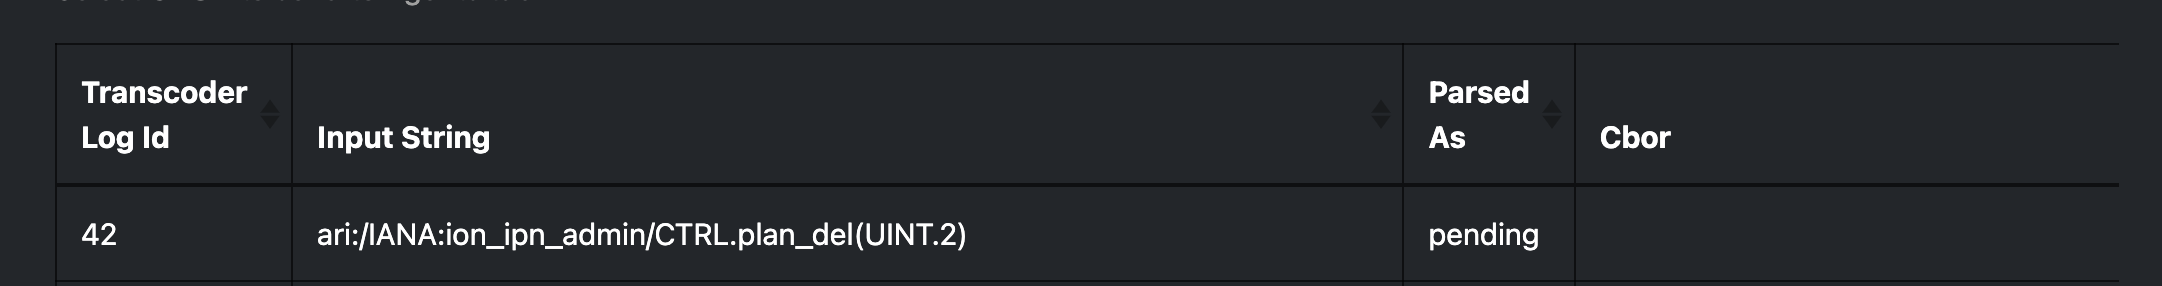
An ARI that is currently being translated by the ANMS will be marked as "pending" in the Parsed As field of the transcoded ARI table, as pictured in Figure 1.32, “ARI in "pending" State”. When the ARI translation is complete, the Parsed As field will be updated to show the provided format of the ARI.
The transcoded ARI table provides the following information:
| Column Label | Description | Type | Sample Value | Notes |
|---|---|---|---|---|
Transcoder Log ID | The ID of the transaction. | UINT | 38 | Used primarily for debugging purposes. |
Input String | The user input sent to the Transcoder. | String |
| The URI string shown below the search bar on the ARI Build tab. |
Parsed As | The determined format of the Input String. | STR | URI | Set to "pending" while transcoding is in progress. Set to "URI" if provided input is successfully parsed as a URI. Set to "ERROR" if an error was encountered while translating, see ARI column for the error reported. |
CBOR | The CBOR generated from the Input String. | Hex | 0x8464696574666B64746E6D612D6167656E74236A6E756D2D6D73672D7478 | Agent-parseable ARI. |
Ari | Details regarding ARI parsing from the transcoder. | STR | "Failed to process: Error decoding from | Set to a populated "ReferenceARI" object if transcoding was successful. |
Uri | The URI generated from the user input. | STR | "ari:/EXECSET/n=13;(//ietf/dtnma-agent/CTRL/inspect(//ietf/dtnma-agent/EDD/const-list(/BOOL/true)))" | Set to "" if transcoding was unsuccessful. Should be the same value of "Input String" if "type" is "URI". Consult the Ari field for further details on parsing/processing errors. |
The ANMS-generated CBOR in the table provides ARIs in the format Agents expect. To send the CBOR ARI to an Agent, click the value in the table. This will display all registered Agents. When an Agent is selected, the details for that Agent and the option to send a CBOR ARI is provided. This process is discussed in detail in Section 1.3, “Agents”.
Also included int the transcoder log table are checkboxes that can be used to send multiple ARI to the agents page at once. The values will be sent to the agents in the order in which they are selected in the transcoder log table. There is a button at the bottom of the table labeled Send to Agents that can be selected to send the ARIS to the Agents page.
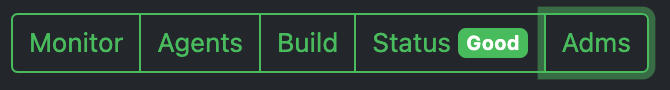
1.5. Status

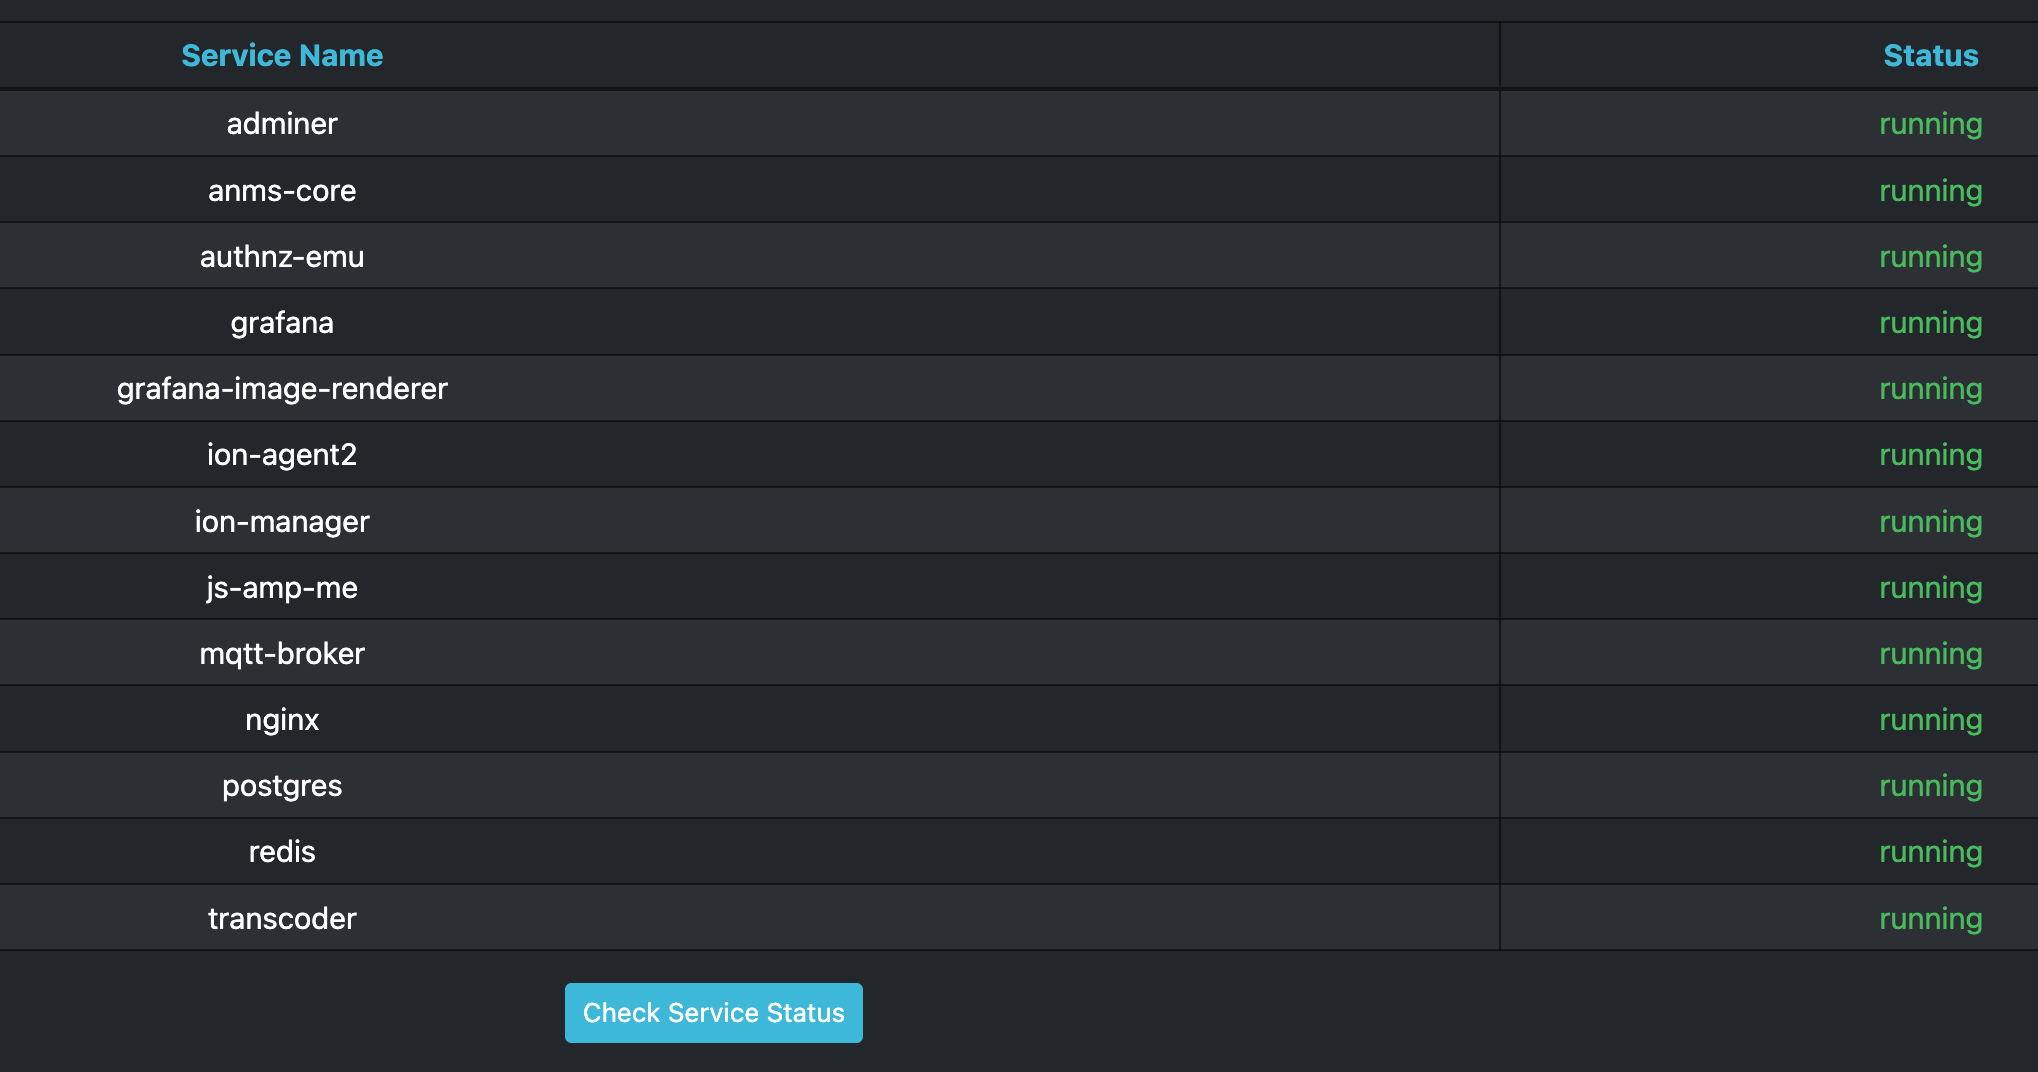
The Status page provides a summary of the overall health and status of the ANMS services. If all ANMS containers are up and running, a green "Good" label is included in the Status tab header. Selecting the Status page provides a list of the ANMS services and their individual statuses. All statuses will be set to "running" and displayed in green to indicate that the overall health of the ANMS system is good.
Select the "Check Service Status" button to refresh the health and status data displayed for the ANMS services.
This service is dependent on the anms-core service, so if it is in an error state then this page will display an AxiosError: Request failed with status code 502 error message.
1.6. ADMs
The ADMs page of the ANMS displays the Application Data Models (ADMs) known to the system, and allows a user to upload additional ADM files.
1.6.1. Displaying Supported ADMs
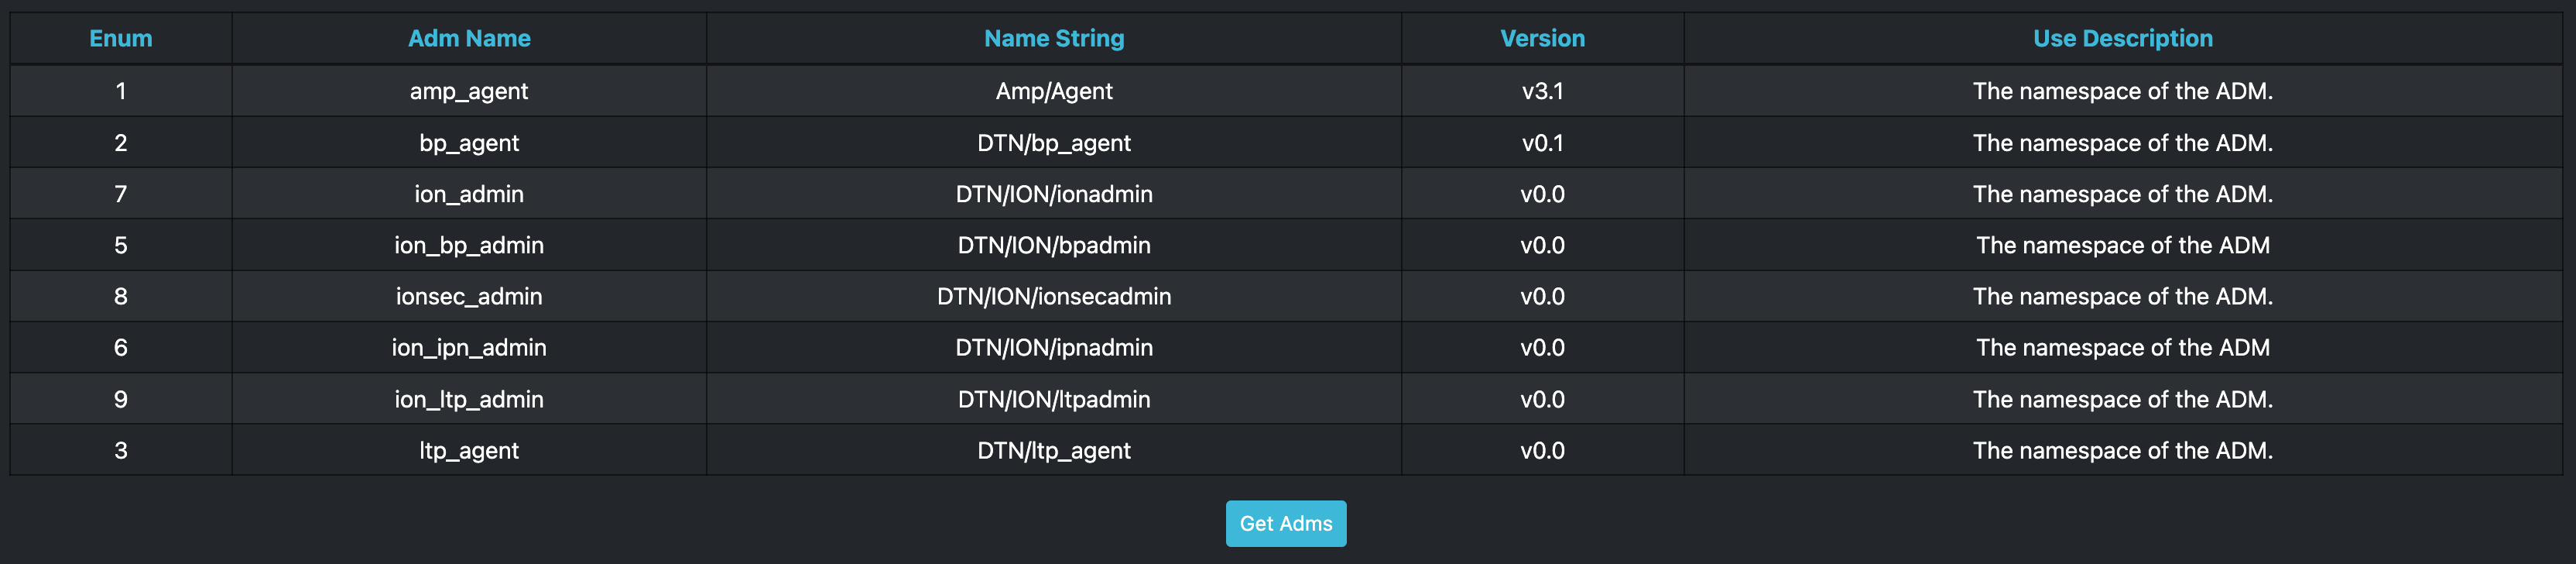
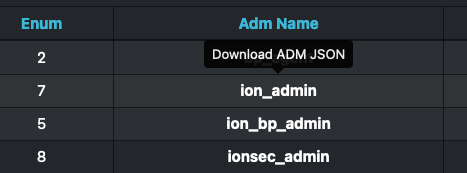
Selecting the "Get ADMs" button, a user can refresh the table of supported ADMs. The table displays the Enumeration, Name, Namespace, Version, and Use Description associated with each ADM.
1.6.2. Downloading ADMs
Clicking an ADM’s download button will download the associated yang file.
1.6.3. Adding ADMs
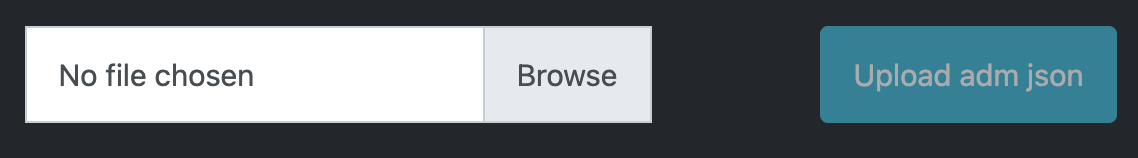
The file selection option at the bottom of the ADMs page allows a user to add an ADM to the ANMS. Selecting the "Browse" button, the user can select any JSON ADM file from their local filesystem. Selecting the blue "Upload adm yang" button will upload the file and the ADM information is populated in the table above. Uploading an ADM causes updates to the ANMS database but will not extend these changes to registered agents. Updating individual agents would be an action that is specific to the environment in which the registered agents are deployed in.
If the new ADM is not displayed in the table, it may be necessary to click the "Get ADMs" button to refresh the table contents.
Chapter 2. Workflows
The workflows presented in the following sections provide examples of common ANMS use cases and a walkthrough of the steps taken to produce the described results.
2.1. Display Data with a Custom Grafana Panel
The Monitor tab of the ANMS allows a user to construct custom panels for data visualization using Grafana, as discussed in Section 1.2.2, “Creating Custom Panels”. This sample workflow shows the construction of a custom panel to view a report variable for an AMP agent, but can be modified to plot any data points of interest within the ANMS UI.
In this example, the user wants to know the number of times a report message is sent by a particular agent.
This can be achieved using Grafana to plot the num-msg-rx EDD defined in the dtnma-agent ADM. An execution set containing the (ari://ietf/dtnma-agent/CTRL/inspect("ari://ietf/dtnma-agent/EDD/num-msg-rx") control would of had to be sent to the agent to generate these results. This example uses the execution set ari:/EXECSET/n=1234;(ari://ietf/dtnma-agent/CTRL/inspect("ari://ietf/dtnma-agent/EDD/num-msg-rx"))
Grafana uses SQL queries to pull data from the ANMS database and display it to the user.
The code block below is an SQL query that will retrieve all report information in the ANMS database. This is the starting point for plotting any information from reports received by the Manager. This query is the same as the one used to generate the Received Reports Grafana panel in the ANMS UI’s default configuration.
SQL Query for All Report Information
-- all reports
SELECT
    reference_time,
    agent_id,
    correlator_nonce,
    report_list
FROM
    ari_rptset
To plot a specific variable from a specific execution_set use a where clause to select only report sets that match the correlator_nonce for the execution_set that contains the needed information, for this example the correlator_nonce 1234 was used.
In the example below, in order to retrieve the num-msg-rx value, we need to incorporate an SQL REGEXP_MATCHES function to separate entries in the report_list field.
The execution_set used the inspect control that takes one parameter, the element you want to generate values for, so for this example that parameter is num-msg-rx which means the report sets generated will only contain one value. We can then generate a regular express, '^.*;\(/UVAST/(\d+)\)\)$', that pulls the /UVAST/ value ( the only value in the report set) from the report_list field.
Finally, we cast the value to the proper type. Now the query SQL Query for Number of Time-Based Rules Run by an Agent can be executed to extract the data needed to generate a Grafana graph.
SQL Query for Number of Time-Based Rules Run by an Agent
SELECT
    floor(extract(epoch from reference_time::timestamp)/60)*60 as time,
    (REGEXP_MATCHES(report_list,'^.*;\(/UVAST/(\d+)\)\)$'))[1]::int as value,
    agent_id AS metric
FROM ari_rptset
where correlator_nonce = 1234
group by 1, agent_id, report_list
order by time asc
To use this SQL query and extract the relevant data, toggle Grafana to text-edit mode, then insert the SQL.
After inserting the formatted query, a sample visualization will be displayed.
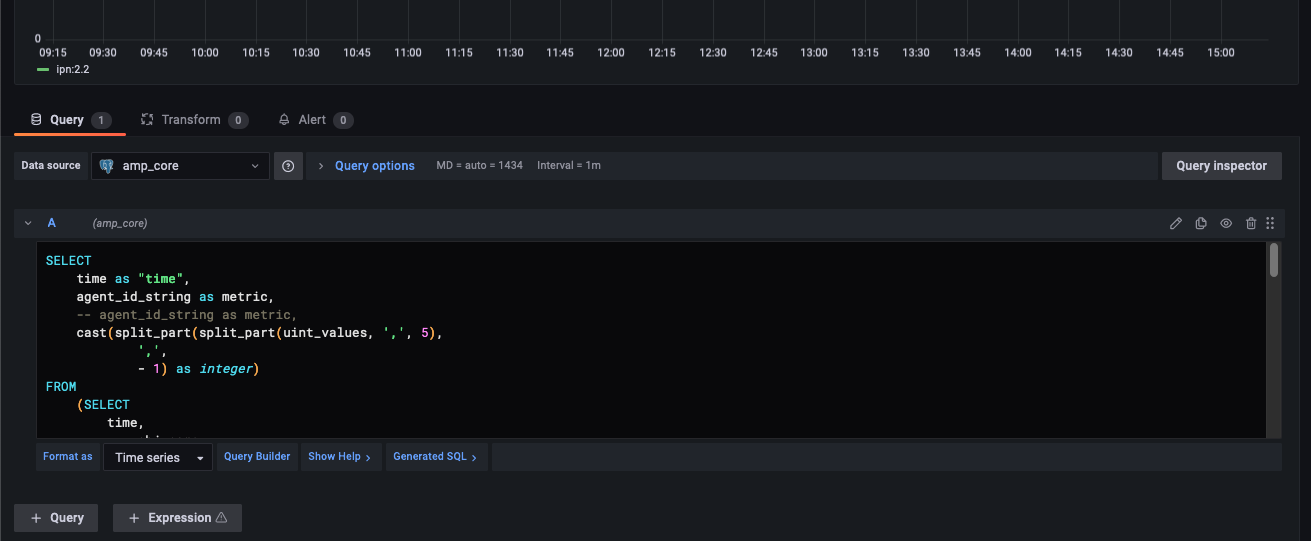
After setting final options, such as graph title, the panel is ready to be saved and viewed on the Monitor tab.
In this sample panel, the number of report message generated by each registered Agent is plotted over the period of time the Manager has been receiving data.
To refine the timeframe the data is shown for, edit the SQL query to include a condition in the WHERE block.
2.2. Receiving Agent Data
Agents in the ANMS can be configured to monitor applications and services. The data they produce can be requested by a Manager as a report or
table, depending on the associated data template, and viewed either on the Agents tab of the ANMS, or used to produce custom Grafana
visualizations on the Monitor tab.
2.2.1. Generate a Report
To generate a report, the inspect or report-on control can be used.
inspect accepts one parameter:
1. An ARI of the object(EDD, CONST, or VAR) that you would like to report the value of
report-on accepts two parameters:
1. An ARI Collection (AC) specifying the report template(s) that should be populated by the Agent.
2. A endpoint-or-uri identifying the Manager(s) that are the intended recipients of the report(s). Can be null.
First, navigate to the Build tab of the ANMS and toggle the switch at the top to use the ARI Builder. Check the Execution set box and enter in a unique nonce.
In the ARI search box, find the AMP Agent report-on or inspect control.
ari://ietf/dtnma-agent/CTRL/report-on(//ietf/amm-base/typedef/rpt-tgt/template,//ietf/network-base/typedef/endpoint-or-uri|/aritype/null/destinations)
ari://ietf/dtnma-agent/CTRL/inspect(//ietf/amm-base/typedef/VALUE-OBJ/ref)
Next, the parameters for the control must be chosen. Select the object to be populated by the Agent.
For this sample workflow, the num-exec-succeeded EDD is selected with the Inspect control.
The system create the AC and any additional parameter fields as needed. num-exec-succeeded does not require any parameters,
Now that all the parameters are filled out, select the SUBMIT ARI String button which will generate the string ARI. This string ARI is sent to the
transcoder and will be available in the lower table after it has ben processed.
Resulting String ARI: ari:/EXECSET/n=42;(ari://ietf/dtnma-agent/CTRL/inspect(ari://ietf/dtnma-agent/EDD/num-exec-succeeded))
CBOR: 0x821482182A8564696574666B64746E6D612D6167656E742267696E7370656374818464696574666B64746E6D612D6167656E7423726E756D2D657865632D737563636565646564

Now that the control has been built, the CBOR can be sent to the desired Agent(s). Click the CBOR entry for the translated ARI and
the UI will redirect to the Agents tab.
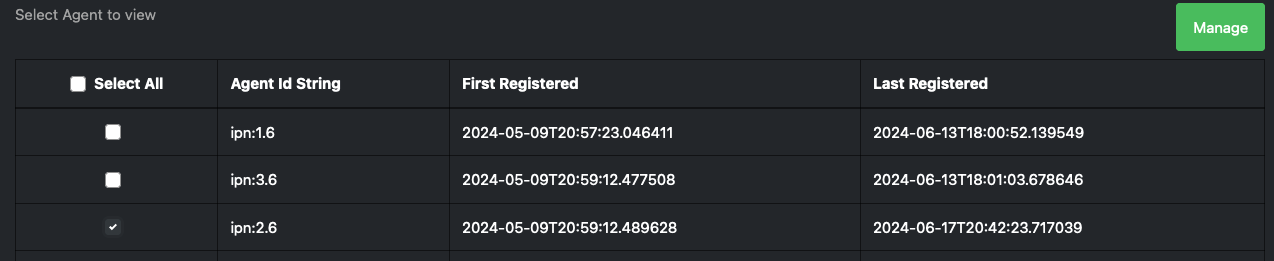
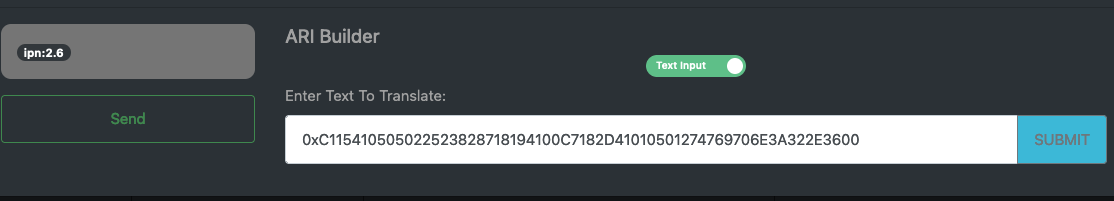
From the available agent table, select the Agent(s) to send the control to. In Figure 2.8, “Manage Agent ipn:2.6”, the Agent address selected ipn:2.6.
Select the Manage button to open a menu of options for Agent handling. The input field for a Text Input will be auto-filled
with the CBOR selected from the Build tab. Select the Submit button and then Send to send the CBOR command to the Agent.
After successfully sending the control to the Agent a success popup should be displayed in the upper right portion of the screen.
After successfully sending the control to the Agent a success popup should be displayed in the upper right portion of the screen.

2.3. Defining Agent Rules
Rules are still under Development in DTNMA-tools which is the system ANMS is currently using to handle agent management/
Chapter 3. Product Support
There are two levels of support for the ANMS: troubleshooting by the administrator or user attempting to operate the ANMS, which is detailed in Section 3.1, “Troubleshooting”, and upstream support via the ANMS public GitHub project, accessible as described in Section 3.2, “Contacting or Contributing”. Attempts to troubleshoot should be made before submitting issue tickets to the upstream project.
3.1. Troubleshooting
The following situations provide troubleshooting guidance for the ANMS from the perspective of a normal or administrative user, typically operating the ANMS via a web browser. Each situation consists of an observed state followed by a recommended troubleshooting activity.
The Grafana panels in the Monitor tab displays Connection was reset errors
The Grafana container may not have started successfully. Contact a system administrator to restart the component.
An Agent is not present in the Agents tab on start up
This is likely due to an error in one of the ION containers and their connection to the underlying database. Contact a system administrator to restart the component.
Registering a new Agent does not result in an update to the displayed Agents in the ANMS Agent tab
Contact a system administrator to verify that the Agent has been registered to the Manager via CLI tools.
3.2. Contacting or Contributing
The ANMS is hosted on a GitHub repository [anms-source] with submodule references to several other repositories.
There is a CONTRIBUTING.md document in the ANMS repository which describes detailed procedures for submitting tickets to identify defects and suggest enhancements.
Separate from the source for the ANMS proper, the ANMS Product Guide and User Guide are hosted on a GitHub repository [anms-docs], with its own CONTRIBUTING.md document for submitting tickets about either the Product Guide or User Guide.
While the GitHub repositories are the primary means by which users should submit detailed tickets, other inquiries can be made directly via email to the the support address dtnma-support@jhuapl.edu.