Timeline Editing
Here we describe how to edit the timeline using the Aerie UI. For more details on the full timeline definition please refer to the UI Views documentation.
Edit Timeline Properties
Edit general timeline properties from within the timeline editor panel. If multiple timelines exist you can use the top dropdown to edit different timelines.
Changes made in the Timeline Editor are not automatically saved and must be saved to the UI view.
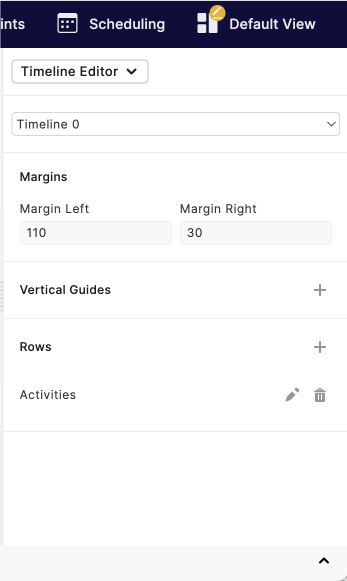
Edit Timeline Margins
Edit the left and right margins of the timeline. This can be useful when you have a row with many resource layer axis labels.
Manage Vertical Guides
Click on the plus button to add a new vertical guide to the timeline. By default vertical guides will appear in the center of the timeline view. vertical guides that you have created directly on the timeline will also appear here. Edit the properties of your vertical guides directly in the list of vertical guides. Click on the trashcan icon to delete a vertical guide.
Manage Rows
Click on the plus button to add a new row to the timeline. A row will be added below the other rows. By default rows will have no layers within them. Click and drag on a row to re-order the row. Click on the trashcan icon to delete a row.
Edit a Row
Edit row properties from within the timeline row editor. If multiple rows exist you can use the top dropdown to edit different rows. A blue highlight will appear around the row in the timeline that you are currently editing. You can also edit a row by clicking on the pencil icon in the header of a row in the timeline.
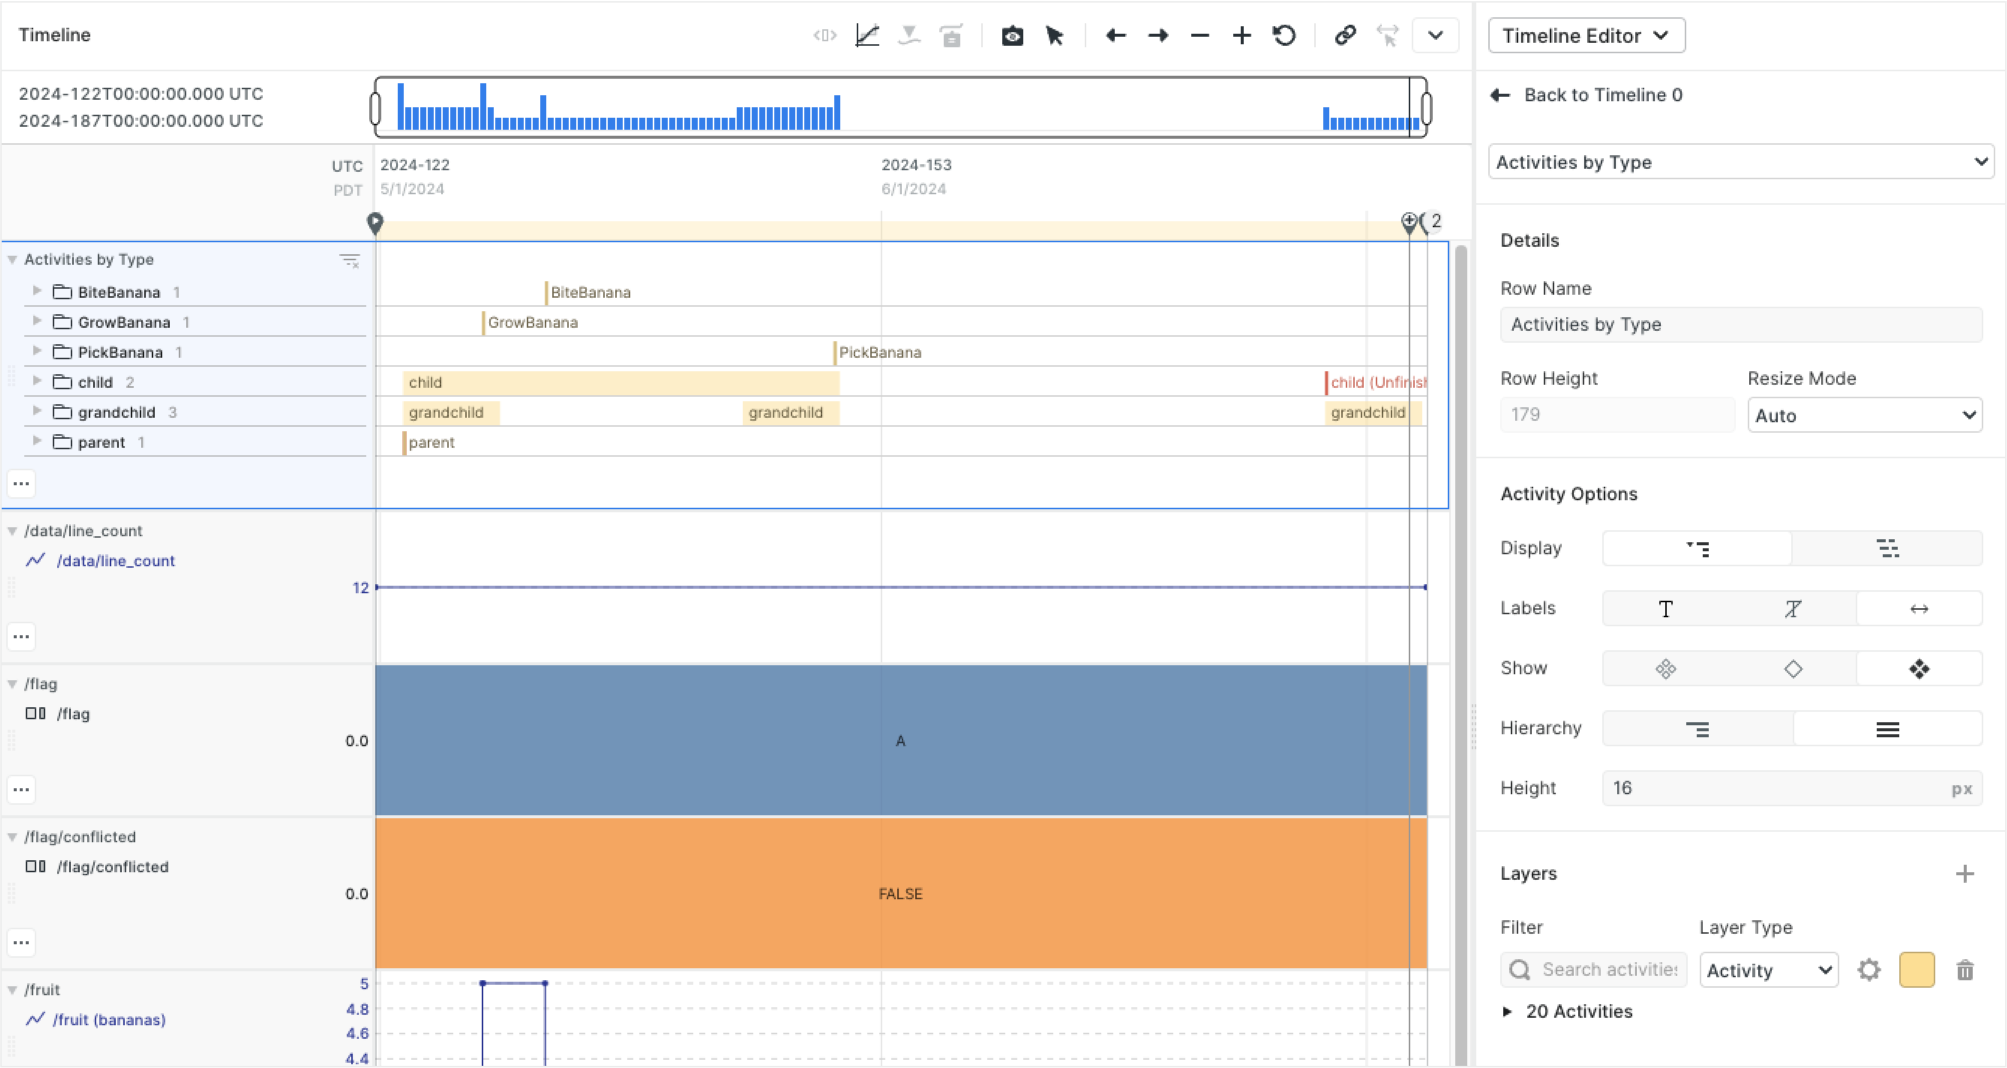
Add an Activity Layer
To visualize activities on the timeline, add a new activity layer using the plus button in the Activity Layers section. The default Aerie UI view creates a row with a single activity layer with all activities grouped by type. Manage which activities are visualized in an activity layer by clicking on the Activity Layer filter button within the layer. Activity filtering will be explained in the next section. You can also manage the color of the activities rendered by this layer using the color picker. All activity layers within a single row are drawn on the same canvas so that all of the activities are grouped and packed together correctly. Below is a demonstration of this workflow.
Filter Activities
Each activity layer can be configured with a custom filter on activity types and directive/span instance properties. Clicking on the default Activity Layer button on a layer will open the Activity Filtering overlay. This overlay can be repositioned by dragging on the top bar of the overlay. The overlay can also be resized using the resize handle in the bottom right of the overlay. With this overlay you can:
- Manually specify activity types to include in the layer
- Dynamically specify activity types to include in the layer by type name and/or subsystem
- Apply other filters on top of the manual and dynamic type filters that target specific directives/spans. This includes filtering by tags, activity name, scheduling goal id, and activity parameter values. These filters can also be applied to specific activity types.
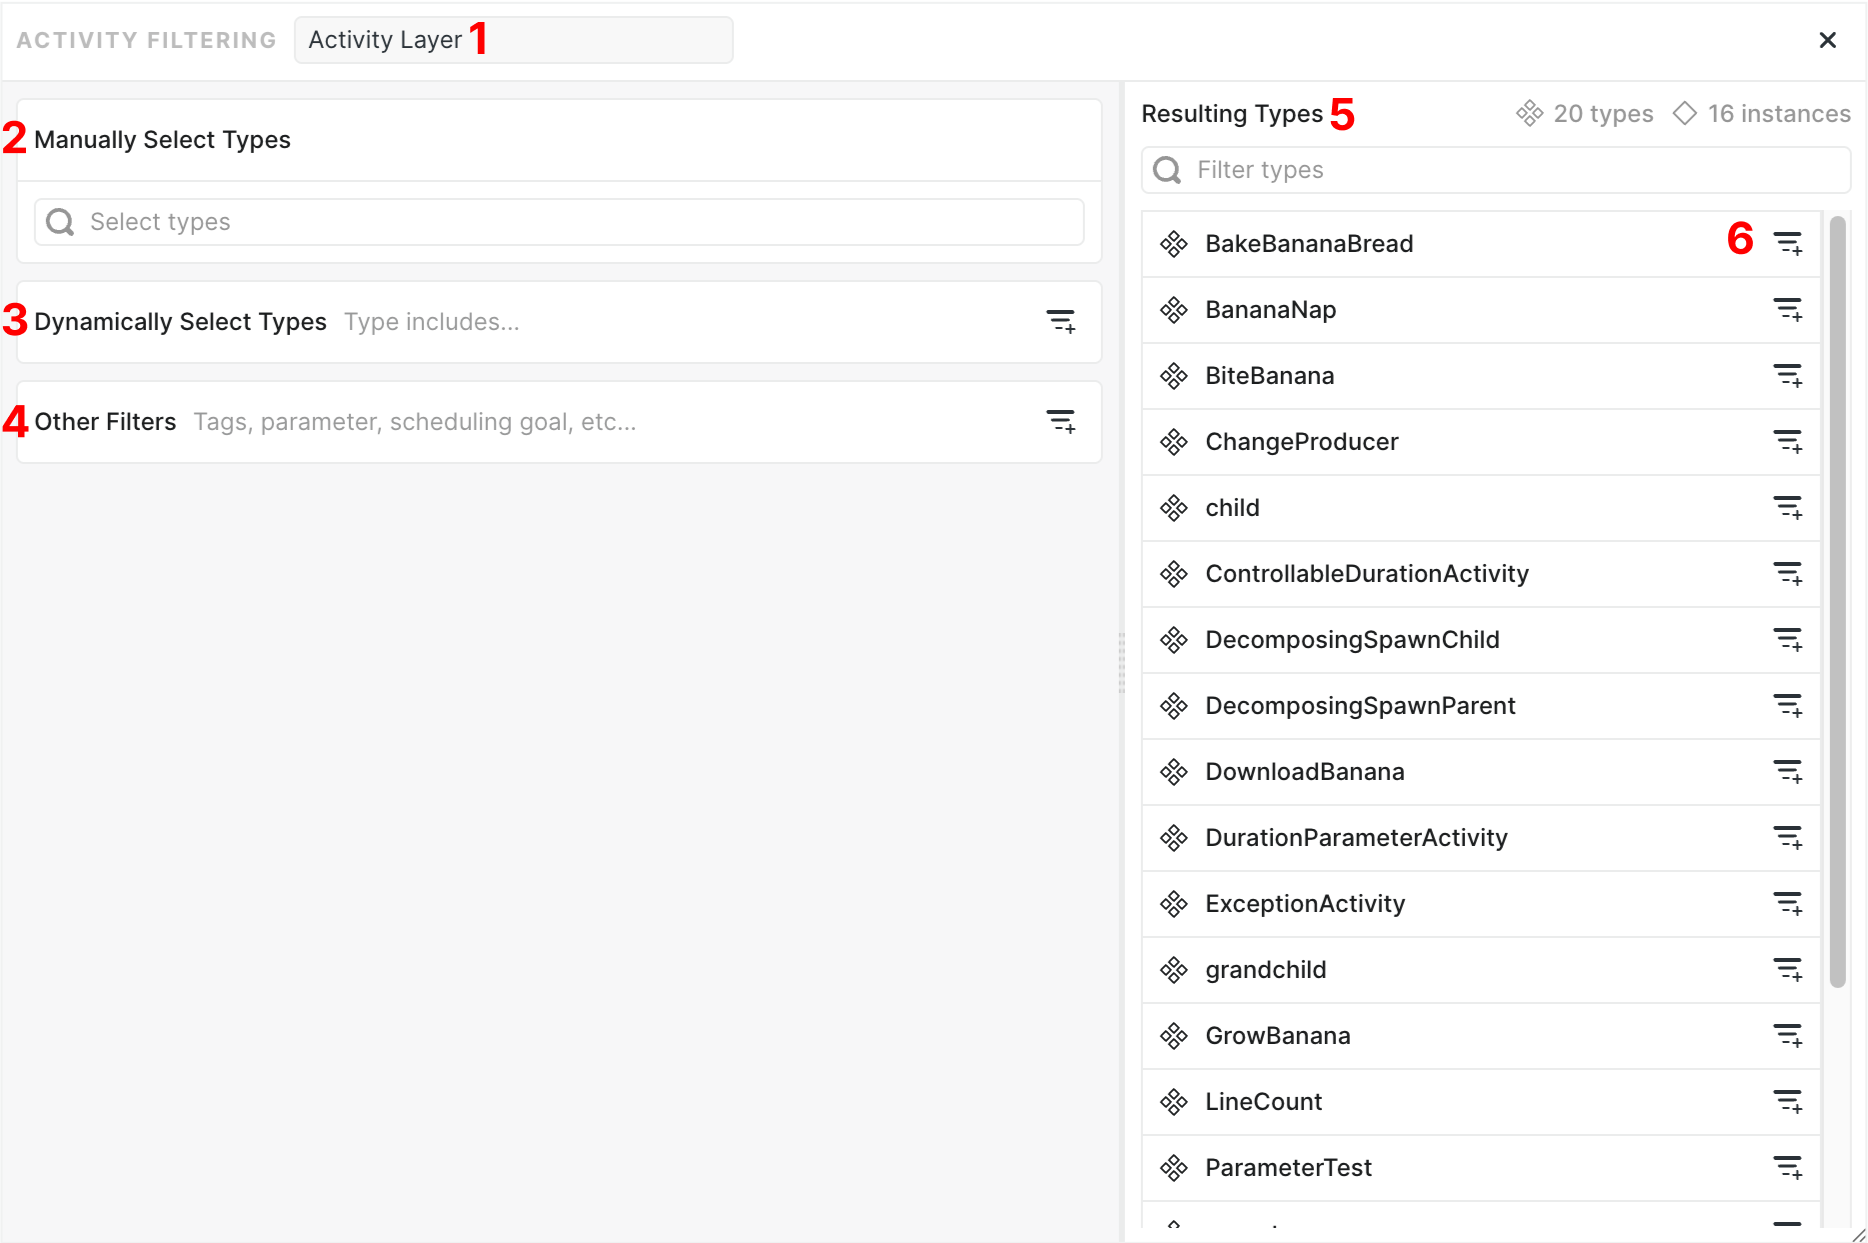
1. Layer Name
Change the activity layer name. It is recommended that you name your activity layers when you have multiple activity layers within a row in order to better keep track of what your layers are filtering on. No name is automatically generated from your filters.
2. Manually Select Types
Manually select specific activity types to render in the activity layer. This is useful when you want tighter control over a small set of activity types.
3. Dynamically Select Types
Dynamically select activity types by type name and/or subsystem. Click on the filter with the plus button to add a new clause. For example, you could create a filter such as Type includes "banana" to match all activity types that include the string banana. This matching is case insensitive. Each clause is ANDed together, so if you add another clause such as Type does not include "grow" the final statement would be Type includes "banana" AND does not include "grow". Dynamic type filters are stored as clauses within the UI View so that they can be dynamically applied to any model.
The resulting activity types for a filter are determined using the union of the manual and dynamic types. If no manual or dynamic type filters are added, all activity types are by default included.
4. Other Activity filters
Filter activity directive and span instances by tags, activity name, scheduling goal id, and activity parameter values. These filters apply to the set of manually and dynamically selected types (or all types if none specified). These filters behave similarly to dynamic types – each clause is ANDed together. For example, you could create a filter such as Tag includes (FOO or "Bar") AND Parameter "biteSize" equals 1. The list of parameters is filtered by the list of resulting activity types. Additionally, parameters are uniquely identified in the filter by the combination of parameter name and parameter type. Parameter filtering works across activity types when the parameter name + type is shared - a common use case when multiple spacecraft are being modeled that share certain parameters.
5. Resulting Types
This section shows the list of types resulting from the manually and dynamically selected types. If no manual or dynamic filters have been specified, all types in the model will be included. The indicator to the right of the Resulting Types text shows the number of resulting types followed by the number of "instances" which is the number of directives and spans (where each span does not have a direct parent directive) that match your filters.
6. Resulting Type Filter
Add other filters (see 4) to a specific activity type in order to further filter instances of that type.
Manage how Activities and Events are Rendered
A Layer Options section will appear in the row editor when the row has at least one activity or event layer. Layer Options affect how activities and events are rendered for this row.
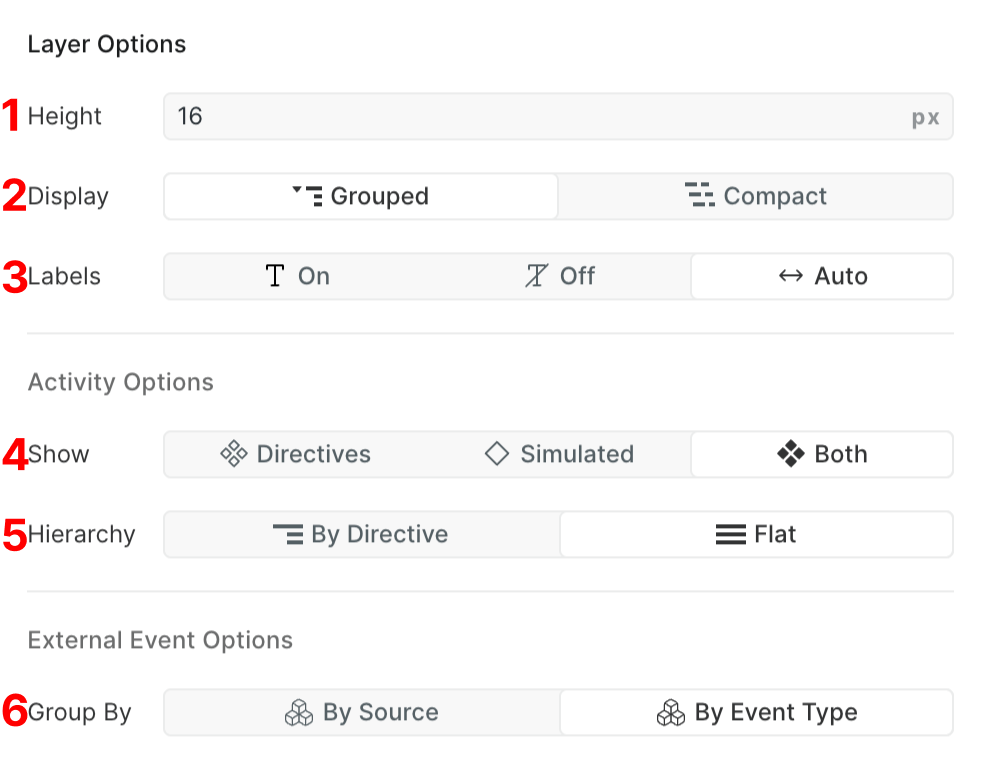
1. Height
Sets the height of activities and events in the row.
2. Display Mode
Activities and events can be rendered in two ways:
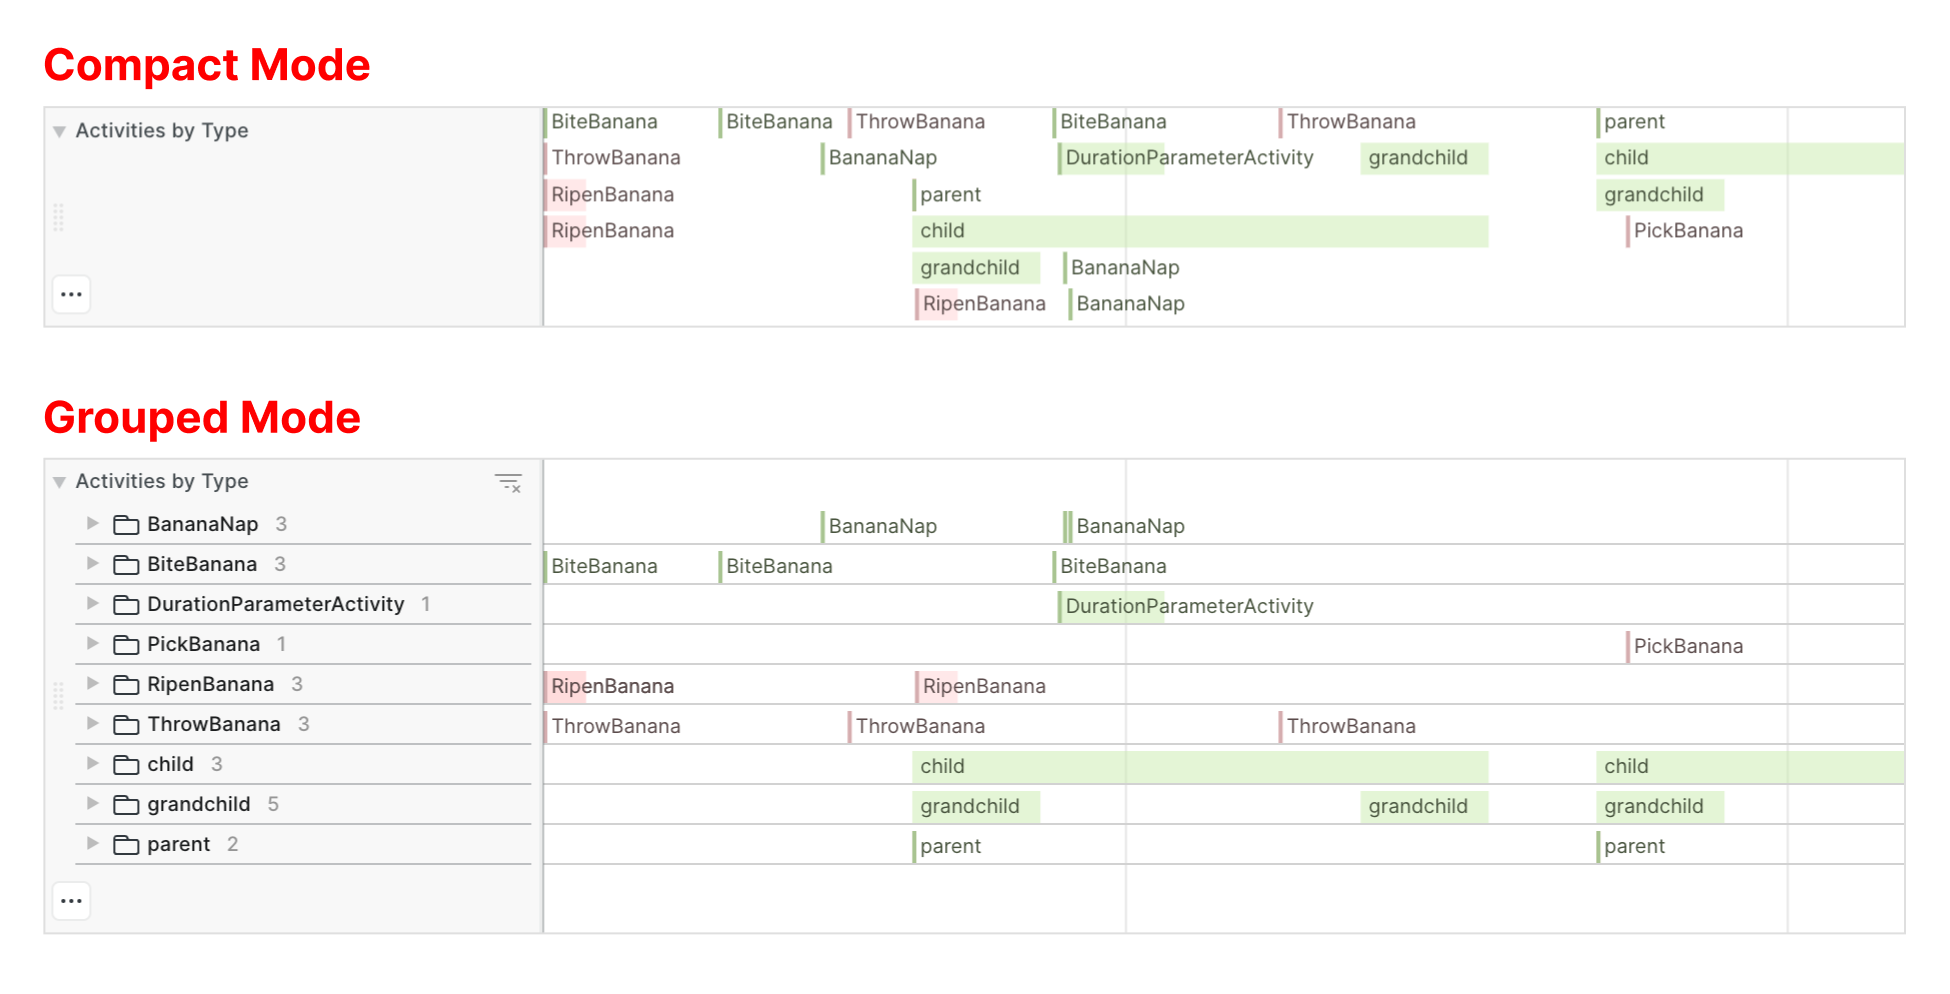
Grouped Mode: Activities are recursively grouped by type. In this mode, activity groups appear in the left side of the row and can be expanded to reveal the directives and spans within each type group. If a directive/span has descendant, the directive/span can be expanded to reveal its grouped descendants. This behavior continues down the decomposition tree until the resulting directive/span has no descendants. This mode is useful for understanding larger sets of activities in a broad sense across an entire plan, especially if the plan is long or contains a significant number of activities that cannot easily be visualized in a small area. Events render in a similar manner to activities.Compact Mode: Activities from all of the layers are packed together in a space efficient waterfall manner. This mode is useful for visualizing smaller sets of activities in a more traditional timeline view. In this mode the row will not autosize and must be manually adjusted to accommodate the current activity packing solution. This allows for a more precise adjustment of the density in the timeline. Events render in a similar manner to activities.
3. Label Visibility
There are several options to control how activity and event labels appear in the timeline:
On: Always show labels regardless of collision.Off: Never show labels.Auto: Show labels when they do not collide with other labels or rectangles.
A Layer Options section will appear in the row editor when the row has at least one activity or event layer. Layer Options affect how activities and events are rendered for this row.
Activity Specific Options
4. Directive and Span Visibility
By default, both directives and spans are shown in a row. Alternatively you may choose to show only directive or only spans.
5. Hierarchy Root
This option is only available in Grouped mode.
Affects which activities appear in the initial type groups. By default, Flat is selected.
Flat: Both activity directives and spans will appear in the top most type groups. This is useful when examining all activities resulting from a simulation without needing to consider activity decomposition.By Directive: Only activity directives will appear in the top most type groups, effectively hiding any child spans until further down in the trees. This is useful when examining the timeline from a decomposition perspective.
Event Specific Options
6. Directive and Span Visibility
This option is only available in Grouped mode.
Group events either by event source or by event type.
Understanding the Grouped Activity Tree
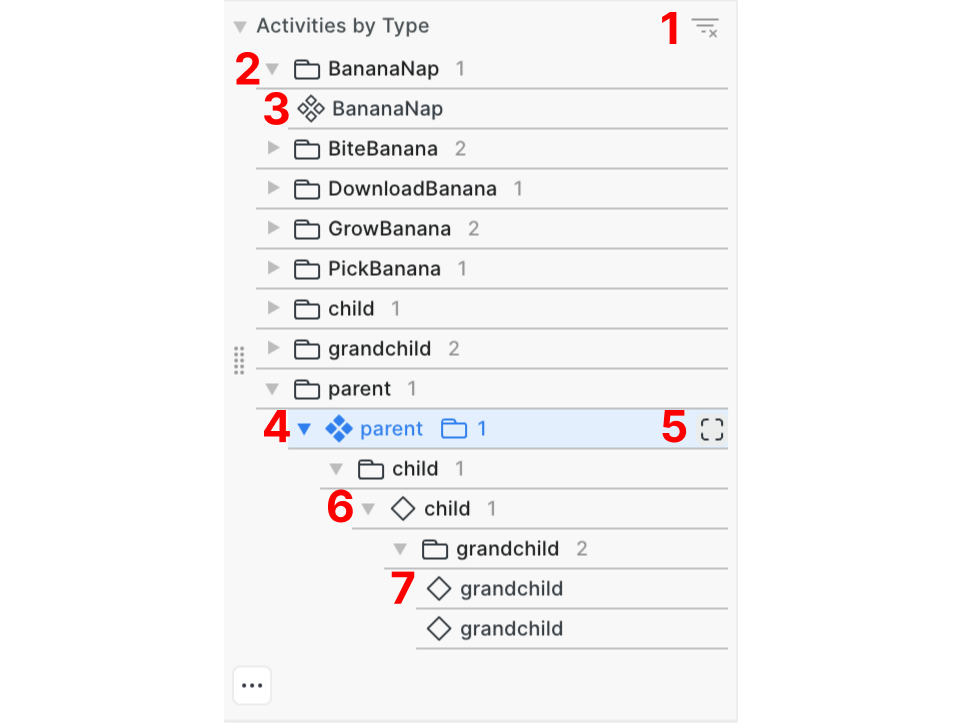
In Grouped mode the activity tree presented in the row header has several important indicators and actions:
Filter Activities by Time Window- Automatically filter nodes in the tree when you zoom and pan around in the plan.- This folder represents a group of activities whose type is
BananaNap. Groups can contain both directives and spans. - This icon represents a directive without a span.
- This icon represents a directive and its root span. The
parentspan has children spans which can be expanded as demonstrated here. - Click on this button while hovering over an expandable folder/element in the tree to select that directive/span. In this case, the
parentrow is blue since it has been selected. Note that when selecting a combined directive and span node, the span details will be preferred over the directive details. You can jump between span and directive using a button in the top right of theSelected Activitypanel. - This icon represents a span. In this case,
childis a span that also has children which are expanded below and grouped appropriately. - This node is a span that does not have any children. The node can be selected by clicking directly on the node. Double click to open the
Selected Activitypanel if not already open.
Add a Resource Line Layer
To show resources on the timeline in a line plot, add a new resource layer using the plus button in the Resource Layers section. If the row did not already contain a Y axis, a new one will automatically be created and assigned to the line layer. To select a resource to plot on this layer, click on the input on the layer and select a resource.
Y axes are independent of layers. When you create a new line or x-range layer the layer will automatically be assigned to a Y axis. To modify which Y axis a layer is associated with, click on the settings icon for the layer and select a Y axis from the Y Axis dropdown.
Below is a demonstration of this workflow.
Add a Resource X-Range Layer
To show resources on the timeline in a line plot, add a new resource layer using the plus button in the Resource Layers section and click on the x-range icon next to the line icon. If the row did not already contain a Y axis, a new one will automatically be created and assigned to the x-range layer. A Y Axis is only used to provide a label to the x-range plot. To select a resource to plot on this layer, click on the input on the layer and select one or more resources.
X-Range plots can be shown as line plots through the corresponding option in the layer settings menu. Use this option when you would like to visualize a discrete resource (Banananation's producer resource for example) as a line plot.
Manage Y Axis Settings
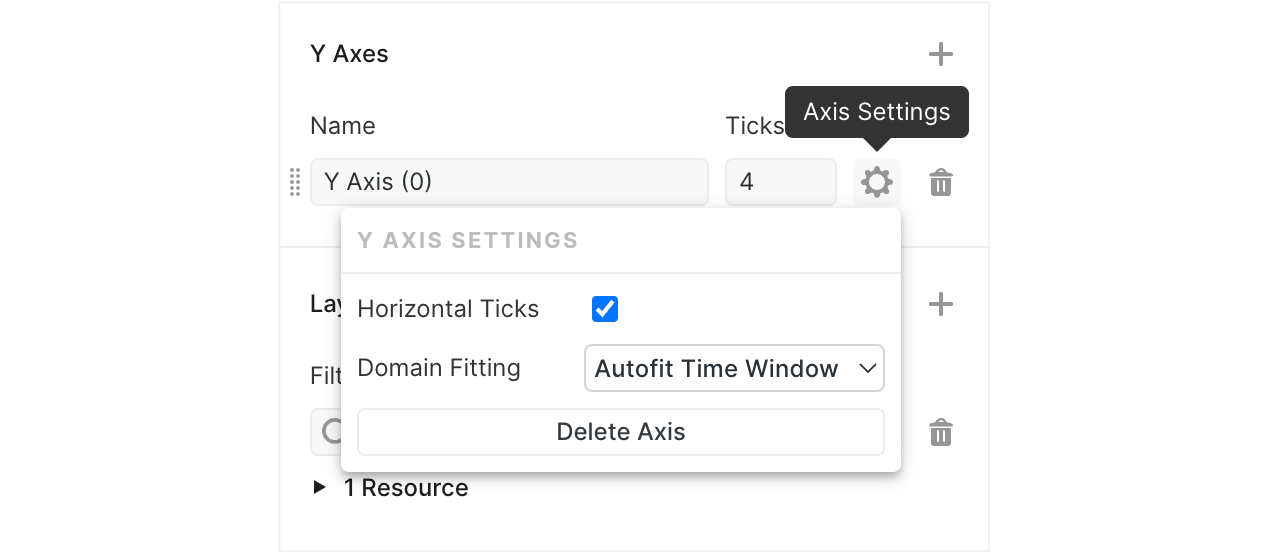
Y Axes have additional options available in the settings menu popover. By default, horizontal ticks are shown and Y Axis domain fitting is set to Autofit Time Window. The domain fitting option controls how the Y Axis domain behaves in response to your plan and current time window and has three modes:
Autofit Plan: Automatically fit the domain to the bounds of all resources associated with the axis across the entire plan.Autofit Time Window: Automatically fit the domain to the bounds of all resources associated with the axis, filtered to the current time window. As you zoom and pan through the plan, the bounds will automatically update and the resources will rescale on the canvas.Manual: Manually enter a static min and max for the axis.
Manage Line and X-Range Names
By default, line and x-range layers will use the name of the resource associated with them when displayed in the row legend on the left and in the tooltip when hovering over a resource. When available, units will be appended to the resource name. To override this resource name, enter a name for the resource within the layer settings menu. Units will still be appended to your custom name.
Manage Horizontal Guides
Horizontal guides can be added to a row when a row has at least one line or x-range layer. Add a horizontal guide using the plus button in the Horizontal Guides section. Horizontal guides are associated with a single Y axis and will use the first available Y axis by default. You can edit the name, Y value, associated Y axis, and color of each horizontal guide from within this section.
Layer Order
Layers have a fixed draw order in a row. X-range layers are on the bottom, activity layers are in the middle, and line layers are on top.